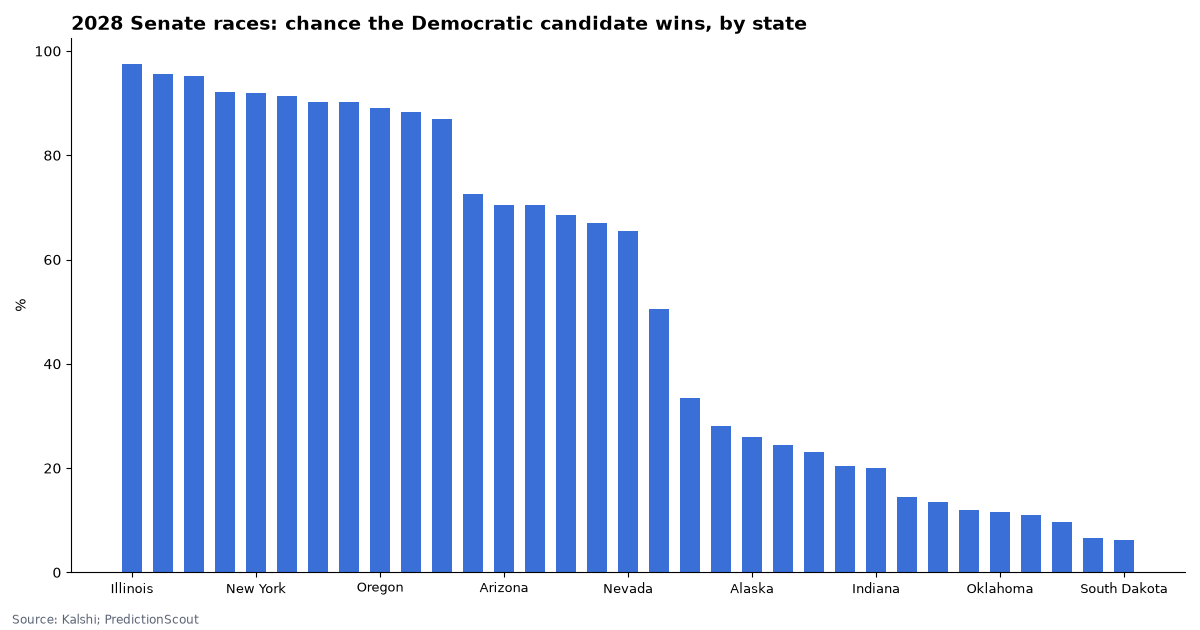
Kalshi lists 33 state markets on the 2028 U.S. Senate elections, the Class III seats last up in 2022.
This page compares each state’s odds with the certified 2022 result for the same seat, and explains how the markets settle.
Kalshi market data and Clerk of the House statistics, pulled Nov 12, 2026, 8:02 AM ET. Updated daily.
By Arthur Angelo, PredictionScout Research · Updated Nov 12, 2026, 8:02 AM ET
Key findings
- 33 state markets are open for the 2028 Senate map. The favorite is Democratic in 18 and Republican in 15.
- 3 seats favor a different party than won in 2022: North Carolina, Ohio, Wisconsin.
- 1 states are within 30 points between the two parties: Ohio.
How these markets work
The question. Each state market asks which party will win that state’s 2028 regular U.S. Senate election. These are the Class III seats, last contested in November 2022, so 2022 is the matching comparison. Some states also list contracts on individual candidates; the party contracts are what we track here.
Settlement. A market resolves to the party of the candidate who wins the general election (or runoff, where a state uses one) as certified. A candidate’s party is the one on the ballot.
What moves the price. Retirements and candidate announcements, primary results, the 2026 results as a read on each state, the 2028 presidential race at the top of the ballot, and, for Senate control, the seats not up until 2030 or later.
Worked example: Georgia. In November 2022 the Clerk’s statistics record Raphael Warnock (Democrat) at 1,946,117, Herschel Walker (Republican) at 1,908,442 and Chase Oliver (Libertarian) at 81,365. No one passed 50%, so Warnock won the December runoff, 1,820,633 to 1,721,244. Kalshi’s 2028 Georgia market today: Democratic 72%, Republican 26%. A $1 Yes contract on the party that wins pays $1 once the result is certified; the other pays nothing.
The 2028 map, state by state
The 2022 column shows the winner of the same seat and their margin over the runner-up. Georgia uses the November general-election count. In Alaska and Utah, the 2022 runner-up wasn’t from the other major party (Alaska: two Republicans; Utah: an independent).
| State | Democratic | Republican | Favored | 2022 winner | 2022 margin | Volume |
|---|---|---|---|---|---|---|
| Alabama | 6% | 94% | Republican | Katie Britt (Republican) | 35.8 pts | 504 |
| Alaska | 26% | 72% | Republican | Lisa Murkowski (Republican) | 0.8 pts | 7,098 |
| Arizona | 70% | 28% | Democratic | Mark Kelly (Democrat) | 4.9 pts | 23,393 |
| Arkansas | 11% | 88% | Republican | John Boozman (Republican) | 34.6 pts | 1,677 |
| California | 96% | 4% | Democratic | Alex Padilla (Democrat) | 21.8 pts | 3,932 |
| Colorado | 91% | 9% | Democratic | Michael F. Bennet (Democrat) | 14.6 pts | 2,597 |
| Connecticut | 95% | 5% | Democratic | Richard Blumenthal (Democrat) | 13.4 pts | 2,271 |
| Florida | 28% | 67% | Republican | Marco Rubio (Republican) | 16.4 pts | 7,000 |
| Georgia | 72% | 26% | Democratic | Raphael G. Warnock (Democrat) | 1.0 pts | 6,960 |
| Hawaii | 88% | 11% | Democratic | Brian Schatz (Democrat) | 45.2 pts | 7,021 |
| Idaho | 12% | 88% | Republican | Mike Crapo (Republican) | 31.9 pts | 3,440 |
| Illinois | 98% | 2% | Democratic | Tammy Duckworth (Democrat) | 15.3 pts | 3,531 |
| Indiana | 20% | 80% | Republican | Todd Young (Republican) | 20.7 pts | 3,186 |
| Iowa | 34% | 66% | Republican | Chuck Grassley (Republican) | 12.2 pts | 6,453 |
| Kansas | 23% | 76% | Republican | Jerry Moran (Republican) | 23.0 pts | 18,690 |
| Louisiana | 14% | 86% | Republican | John Kennedy (Republican) | 43.7 pts | 3,410 |
| Maryland | 92% | 7% | Democratic | Chris Van Hollen (Democrat) | 31.7 pts | 1,841 |
| Missouri | 15% | 85% | Republican | Eric Schmitt (Republican) | 13.3 pts | 2,571 |
| Nevada | 66% | 35% | Democratic | Catherine Cortez Masto (Democrat) | 0.8 pts | 3,959 |
| New Hampshire | 87% | 14% | Democratic | Maggie Hassan (Democrat) | 9.1 pts | 3,981 |
| New York | 92% | 6% | Democratic | Charles E. Schumer (Democrat) | 15.6 pts | 2,100 |
| North Carolina | 70% | 26% | Democratic | Ted Budd (Republican) | 3.2 pts | 86,192 |
| North Dakota | 10% | 89% | Republican | John Hoeven (Republican) | 31.5 pts | 4,505 |
| Ohio | 50% | 46% | Democratic | JD Vance (Republican) | 6.1 pts | 47,508 |
| Oklahoma | 12% | 86% | Republican | Markwayne Mullin (Republican) | 26.5 pts | 2,133 |
| Oregon | 89% | 9% | Democratic | Ron Wyden (Democrat) | 14.9 pts | 1,729 |
| Pennsylvania | 68% | 26% | Democratic | John Fetterman (Democrat) | 4.9 pts | 12,199 |
| South Carolina | 24% | 74% | Republican | Tim Scott (Republican) | 25.9 pts | 34,113 |
| South Dakota | 6% | 92% | Republican | John Thune (Republican) | 43.5 pts | 1,634 |
| Utah | 20% | 80% | Republican | Mike Lee (Republican) | 10.4 pts | 3,517 |
| Vermont | 90% | 9% | Democratic | Peter Welch (Democrat) | 40.5 pts | 8,759 |
| Washington | 90% | 9% | Democratic | Patty Murray (Democrat) | 14.6 pts | 4,523 |
| Wisconsin | 67% | 33% | Democratic | Ron Johnson (Republican) | 1.0 pts | 11,507 |
Senate control in 2028
Kalshi’s market on which party controls the Senate after the 2028 election: Democratic 88%, Republican 11%. Control depends on all 100 seats, including the roughly two-thirds not up in 2028, so it can’t be added up from the state markets alone.
Download the data
2028 Senate state markets today (CSV)
Today’s odds for each state, with the 2022 certified result for the same seat. No price histories are included. Free to reuse under CC BY 4.0 with a link back to this page.
Embed this chart
Methodology
- Markets. Every open Kalshi
SENATE<state>-28event andCONTROLS-2028, from the public API. - Prices. Bid/ask midpoint, only where the spread is 10¢ or less; otherwise a dash.
- 2022 results. The Clerk of the House’s “Statistics of the Congressional Election of November 8, 2022,” for the same Class III seats. Margin is winner minus runner-up as a share of all votes.
- Limits. These markets are 2 years from settlement and many are thinly traded. Candidate fields aren’t set, so prices can move a lot on a single announcement. Nothing here is investment advice. Last run: Nov 12, 2026, 8:02 AM ET.
Cite this research
Suggested citation: PredictionScout. (2026, November 12). 2028 Senate Map Prediction Markets: Odds by State. https://predictionscout.com/research/2028-senate-map-prediction-markets/
For a chart or news story: “Source: PredictionScout analysis of public exchange data (https://predictionscout.com/research/2028-senate-map-prediction-markets/)”
The data and charts on this page are free to reuse under CC BY 4.0 with a link back to this page. Market data: Kalshi. 2022 results: Clerk of the U.S. House of Representatives.
Data sources: prices and volumes come from the public APIs of Kalshi and Polymarket, with 2022 results from the Clerk of the House. All trademarks belong to their owners. PredictionScout is independent and not affiliated with any exchange. Nothing here is investment, betting, or legal advice.
Related: 2028 presidential markets · State legislature markets · All research