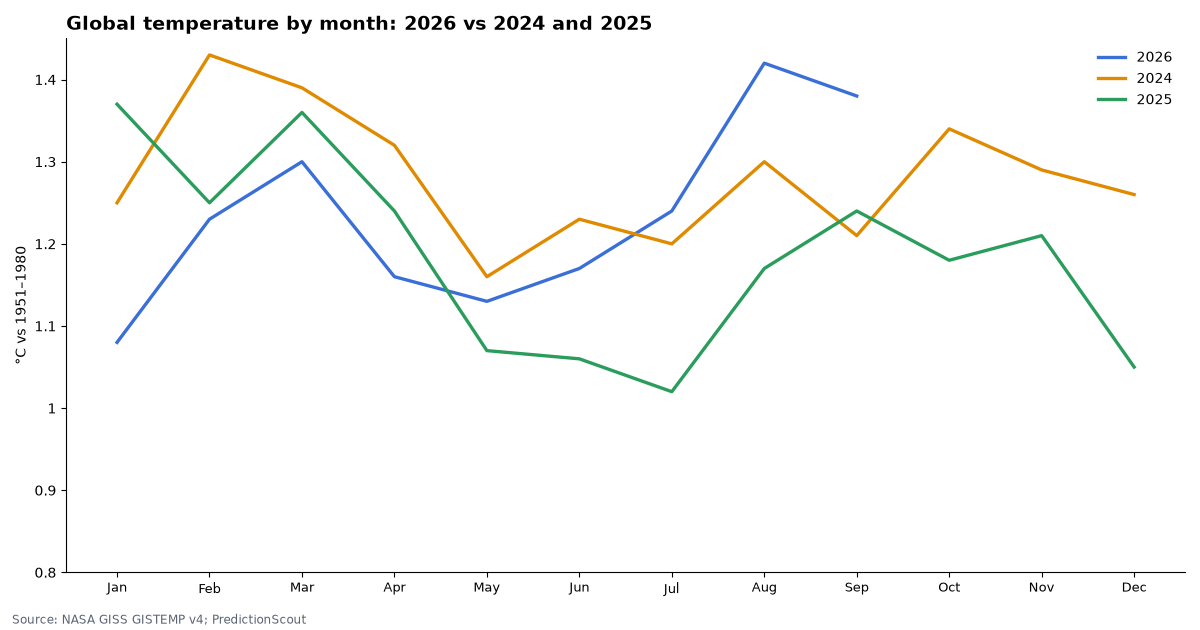
Kalshi gives 66% that 2026 will be the hottest year on record. NASA’s data so far puts it just behind.
NASA’s global temperature index averages 1.23°C above the 1951–1980 baseline for January–September 2026, against the record 1.28°C for 2024. To pass 2024, the remaining 3 months would need to average about 1.42°C, a level only 3 single months have reached in NASA’s record.
Kalshi market data and official statistics, pulled Oct 15, 2026, 7:54 AM ET. Updated daily (NASA updates monthly).
By Arthur Angelo, PredictionScout Research · Updated Oct 15, 2026, 7:54 AM ET
Key findings
- 2026 so far: 1.23°C. Record year: 2024 at 1.28°C. Kalshi’s market resolves on NASA’s annual figure, which must top both 1.28°C and 2025.
- Needed for a record: about 1.42°C a month from October to December. September 2026 came in at 1.38°C. NASA’s annual figure is computed from its monthly values and rounded, so the exact threshold can shift by about 0.01°C.
- Monthly “hottest ever” markets: 30 of 32 called right. Priced 24 hours before each market closed. Brier score 0.035.
- NASA check: 31 of 32 agree. We checked each monthly settlement against whether NASA’s value topped every earlier year for that month. Kalshi’s short monthly rule does not name a data source, so differences are listed below.
- Next: Will Oct 2026 be the hottest Oct ever? Market: 78%. NASA’s record for that month: 1.34°C.
Past “hottest year” markets
| Year | Kalshi result | NASA annual anomaly (°C) |
|---|---|---|
| 2022 | Not a record | 0.89 |
| 2023 | Hottest on record | 1.17 |
| 2024 | Hottest on record | 1.28 |
| 2025 | Not a record | 1.18 |
Monthly “hottest ever” markets
| Month | Chance 24h before | Kalshi result | NASA anomaly (°C) | Prior NASA record for the month | NASA agrees |
|---|---|---|---|---|---|
| Sep 2026 | 2% | NO | 1.38 | 1.48 | ✓ |
| Aug 2026 | 100% | YES | 1.42 | 1.30 | ✓ |
| Jul 2026 | 21% | NO | 1.24 | 1.20 | differs |
| Jun 2026 | 0% | NO | 1.17 | 1.23 | ✓ |
| May 2026 | 1% | NO | 1.13 | 1.16 | ✓ |
| Apr 2026 | 0% | NO | 1.16 | 1.32 | ✓ |
| Mar 2026 | 4% | NO | 1.30 | 1.39 | ✓ |
| Feb 2026 | 1% | NO | 1.23 | 1.43 | ✓ |
| Jan 2026 | 0% | NO | 1.08 | 1.37 | ✓ |
| Nov 2025 | 1% | NO | 1.21 | 1.40 | ✓ |
| Oct 2025 | 1% | NO | 1.18 | 1.34 | ✓ |
| Sep 2025 | 1% | NO | 1.24 | 1.48 | ✓ |
| Aug 2025 | 0% | NO | 1.17 | 1.30 | ✓ |
| Jul 2025 | 0% | NO | 1.02 | 1.20 | ✓ |
| Jun 2025 | 1% | NO | 1.06 | 1.23 | ✓ |
| May 2025 | 0% | NO | 1.07 | 1.16 | ✓ |
| Apr 2025 | 1% | NO | 1.24 | 1.32 | ✓ |
| Mar 2025 | 8% | NO | 1.36 | 1.39 | ✓ |
| Feb 2025 | 0% | NO | 1.25 | 1.43 | ✓ |
| Jan 2025 | 100% | YES | 1.37 | 1.25 | ✓ |
| Dec 2024 | 0% | NO | 1.26 | 1.35 | ✓ |
| Nov 2024 | 6% | NO | 1.29 | 1.40 | ✓ |
| Oct 2024 | 1% | NO | 1.34 | 1.34 | ✓ |
| Sep 2024 | 6% | NO | 1.21 | 1.48 | ✓ |
| Aug 2024 | 48% | YES | 1.30 | 1.19 | ✓ |
| Jul 2024 | 30% | YES | 1.20 | 1.19 | ✓ |
| Jun 2024 | 98% | YES | 1.23 | 1.08 | ✓ |
| May 2024 | 98% | YES | 1.16 | 0.99 | ✓ |
| Apr 2024 | 94% | YES | 1.32 | 1.11 | ✓ |
| Mar 2024 | 50% | YES | 1.39 | 1.35 | ✓ |
| Feb 2024 | 78% | YES | 1.43 | 1.36 | ✓ |
| Jan 2024 | 90% | YES | 1.25 | 1.18 | ✓ |
Download the data
Monthly markets vs NASA (CSV)NASA monthly anomalies (2015 on) (CSV)
One row per settled market period. Per-contract price histories are not included. Free to reuse under CC BY 4.0 with a link back to this page.
Embed this chart
Methodology
- Official data. NASA GISS Surface Temperature Analysis v4, global land-ocean index (GLB.Ts+dSST.csv), anomalies vs 1951–1980. NASA revises past values slightly each month; we use the current file.
- Markets. Kalshi’s
KXGTEMP(hottest year; resolves on NASA’s unsmoothed annual value) andKXHMONTH/HMONTH(hottest month ever), from Kalshi’s public API. Monthly prices are taken 24 hours before close (bid/ask midpoint when the spread is 10¢ or less, otherwise last trade). - Needed value. (record × 12 − sum of months so far) ÷ months remaining.
- Limits. Few annual markets; monthly settlement may rely on a source other than NASA; NASA revisions can change past months by a few hundredths of a degree. Nothing here is investment advice. Last run: Oct 15, 2026, 7:54 AM ET.
Cite this research
Suggested citation: PredictionScout. (2026, October 15). Will 2026 Be the Hottest Year on Record? Prediction Markets vs. NASA's Data. https://predictionscout.com/research/hottest-year-prediction-markets-nasa/
For a chart or news story: “Source: PredictionScout analysis of public exchange data (https://predictionscout.com/research/hottest-year-prediction-markets-nasa/)”
The data and charts on this page are free to reuse under CC BY 4.0 with a link back to this page. Temperature data: NASA Goddard Institute for Space Studies (GISTEMP v4). Market data: Kalshi.
Data sources: prices and volumes come from the public APIs of Kalshi and Polymarket, with temperature data from NASA GISS. All trademarks belong to their owners. PredictionScout is independent and not affiliated with any exchange. Nothing here is investment, betting, or legal advice.
Related: markets vs official numbers · accuracy scorecard · All research