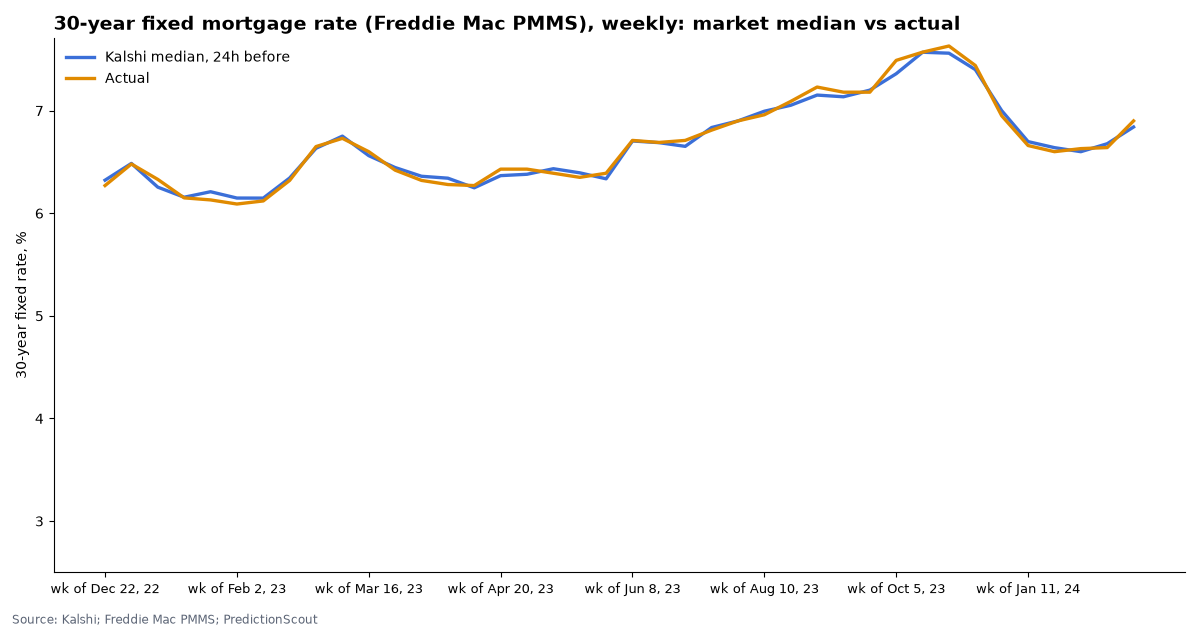
When Kalshi listed weekly mortgage-rate markets, traders missed Freddie Mac’s rate by a median 0.04 points.
We scored 40 weekly Freddie Mac survey releases from Dec 22, 2022 to Feb 22, 2024, the period with priced Kalshi markets. Kalshi has listed no new weekly mortgage-rate market since early 2024. The latest Freddie Mac 30-year rate is 7.40% (week of Oct 8, 2026).
Kalshi market data and official statistics, pulled Oct 12, 2026, 10:04 AM ET. Updated weekly.
By Arthur Angelo, PredictionScout Research · Updated Oct 12, 2026, 10:04 AM ET
Key findings
- Mortgage rates were the easiest number to call. The weekly rate landed a median 0.04 percentage points from the market median a day before, and 93% of 163 threshold contracts went the way the market leaned.
- No lean. The rate came in above the market median 19 times and below it 20 times.
- Thin markets. These were small markets: 147,451 contracts traded across the scored weeks, and many weeks had too few priced contracts to score. Kalshi’s weekly series has had no new events since February 2024.
- Today’s rate. Freddie Mac’s 30-year fixed average was 7.40% in the week of Oct 8, 2026, against 7.28% a week earlier and 6.30% a year earlier.
- Settlements verified: 39 of 40 scored weeks match Freddie Mac’s first-published rate.
30-year fixed mortgage rate (Freddie Mac PMMS), weekly
Across 40 releases from Dec 22, 2022 to Feb 22, 2024, the market’s median a day before was off by 0.04 pt in a typical release (median miss) and 0.04 pt on average. The number came in above the market median 19 times and below it 20 times. Of 163 individual “above X” contracts, the side priced above 50¢ a day out was right 151 times (93%).
| Period | Released | Market median 24h before | Actual (Kalshi settlement) | Official first release | Actual minus median | Contracts called right | Contracts traded |
|---|---|---|---|---|---|---|---|
| wk of Feb 22, 24 | Feb 22, 2024 | 6.84% | 6.90% | 6.90% ✓ | +0.06 pt | 4/4 | 287 |
| wk of Feb 15, 24 | Feb 15, 2024 | 6.50% | 6.77% | 6.77% ✓ | market median outside listed strikes | 2/2 | 205 |
| wk of Feb 8, 24 | Feb 8, 2024 | 6.68% | 6.64% | 6.64% ✓ | -0.04 pt | 4/4 | 1,071 |
| wk of Feb 1, 24 | Feb 1, 2024 | 6.60% | 6.63% | 6.63% ✓ | +0.03 pt | 3/3 | 411 |
| wk of Jan 25, 24 | Jan 25, 2024 | 6.70% | 6.69% | 6.69% ✓ | market median outside listed strikes | 2/3 | 55 |
| wk of Jan 18, 24 | Jan 18, 2024 | 6.64% | 6.60% | 6.60% ✓ | -0.04 pt | 1/2 | 164 |
| wk of Jan 11, 24 | Jan 11, 2024 | 6.70% | 6.66% | 6.66% ✓ | -0.04 pt | 3/3 | 402 |
| wk of Dec 14, 23 | Dec 14, 2023 | 7.00% | 6.95% | 6.95% ✓ | -0.05 pt | 2/2 | 451 |
| wk of Nov 16, 23 | Nov 16, 2023 | 7.40% | 7.44% | 7.44% ✓ | +0.04 pt | 1/1 | 160 |
| wk of Nov 9, 23 | Nov 9, 2023 | 7.50% | 7.50% | 7.50% ✓ | market median outside listed strikes | 4/4 | 1,031 |
| wk of Oct 26, 23 | Oct 26, 2023 | 7.80% | 7.79% | 7.79% ✓ | market median outside listed strikes | 1/2 | 536 |
| wk of Oct 19, 23 | Oct 19, 2023 | 7.56% | 7.63% | 7.63% ✓ | +0.07 pt | 2/3 | 740 |
| wk of Oct 12, 23 | Oct 12, 2023 | 7.57% | 7.57% | 7.57% ✓ | +0.00 pt | 4/4 | 728 |
| wk of Oct 5, 23 | Oct 5, 2023 | 7.36% | 7.49% | 7.49% ✓ | +0.13 pt | 1/2 | 446 |
| wk of Sep 14, 23 | Sep 14, 2023 | 7.20% | 7.18% | 7.18% ✓ | -0.02 pt | 3/3 | 72 |
| wk of Sep 7, 23 | Sep 7, 2023 | 7.20% | 7.12% | 7.12% ✓ | market median outside listed strikes | 2/2 | 2,221 |
| wk of Aug 31, 23 | Aug 31, 2023 | 7.14% | 7.18% | 7.18% ✓ | +0.04 pt | 4/4 | 846 |
| wk of Aug 24, 23 | Aug 24, 2023 | 7.15% | 7.23% | 7.23% ✓ | +0.08 pt | 3/4 | 358 |
| wk of Aug 17, 23 | Aug 17, 2023 | 7.05% | 7.09% | 7.09% ✓ | +0.04 pt | 5/5 | 856 |
| wk of Aug 10, 23 | Aug 10, 2023 | 6.99% | 6.96% | 6.96% ✓ | -0.03 pt | 2/2 | 326 |
| wk of Aug 3, 23 | Aug 3, 2023 | 6.90% | 6.90% | 6.90% ✓ | 0.00 pt | 1/1 | 161 |
| wk of Jul 27, 23 | Jul 27, 2023 | 6.84% | 6.81% | 6.81% ✓ | -0.03 pt | 5/5 | 1,320 |
| wk of Jul 20, 23 | Jul 20, 2023 | 6.80% | 6.78% | 6.78% ✓ | market median outside listed strikes | 3/3 | 1,148 |
| wk of Jul 13, 23 | Jul 13, 2023 | 6.80% | 6.96% | 6.96% ✓ | market median outside listed strikes | 2/2 | 255 |
| wk of Jun 29, 23 | Jun 29, 2023 | 6.65% | 6.71% | 6.71% ✓ | +0.06 pt | 1/2 | 1,207 |
| wk of Jun 22, 23 | Jun 22, 2023 | 6.70% | 6.67% | 6.67% ✓ | market median outside listed strikes | 1/2 | 258 |
| wk of Jun 15, 23 | Jun 15, 2023 | 6.69% | 6.69% | 6.69% ✓ | +0.00 pt | 4/4 | 2,088 |
| wk of Jun 8, 23 | Jun 8, 2023 | 6.70% | 6.71% | 6.71% ✓ | +0.01 pt | 3/3 | 1,989 |
| wk of May 25, 23 | May 25, 2023 | 6.50% | 6.57% | 6.57% ✓ | market median outside listed strikes | 5/5 | 4,876 |
| wk of May 18, 23 | May 18, 2023 | 6.34% | 6.39% | 6.39% ✓ | +0.05 pt | 4/4 | 683 |
| wk of May 11, 23 | May 11, 2023 | 6.39% | 6.35% | 6.35% ✓ | -0.04 pt | 3/3 | 196 |
| wk of May 4, 23 | May 4, 2023 | 6.43% | 6.39% | 6.39% ✓ | -0.04 pt | 3/4 | 811 |
| wk of Apr 27, 23 | Apr 27, 2023 | 6.38% | 6.43% | 6.43% ✓ | +0.05 pt | 4/5 | 10,551 |
| wk of Apr 20, 23 | Apr 20, 2023 | 6.37% | 6.43% | 6.39% differs | +0.06 pt | 5/5 | 1,301 |
| wk of Apr 13, 23 | Apr 13, 2023 | 6.25% | 6.27% | 6.27% ✓ | +0.02 pt | 4/4 | 10,255 |
| wk of Apr 6, 23 | Apr 6, 2023 | 6.34% | 6.28% | 6.28% ✓ | -0.06 pt | 2/3 | 3,668 |
| wk of Mar 30, 23 | Mar 30, 2023 | 6.36% | 6.32% | 6.32% ✓ | -0.04 pt | 5/5 | 3,519 |
| wk of Mar 23, 23 | Mar 23, 2023 | 6.45% | 6.42% | 6.42% ✓ | -0.03 pt | 5/5 | 4,398 |
| wk of Mar 16, 23 | Mar 16, 2023 | 6.56% | 6.60% | 6.60% ✓ | +0.04 pt | 6/6 | 7,155 |
| wk of Mar 9, 23 | Mar 9, 2023 | 6.75% | 6.73% | 6.73% ✓ | -0.02 pt | 5/5 | 9,467 |
| wk of Mar 2, 23 | Mar 2, 2023 | 6.63% | 6.65% | 6.65% ✓ | +0.02 pt | 5/5 | 8,703 |
| wk of Feb 23, 23 | Feb 23, 2023 | 6.50% | 6.50% | 6.50% ✓ | market median outside listed strikes | 4/5 | 2,188 |
| wk of Feb 16, 23 | Feb 16, 2023 | 6.34% | 6.32% | 6.32% ✓ | -0.02 pt | 6/6 | 2,436 |
| wk of Feb 9, 23 | Feb 9, 2023 | 6.15% | 6.12% | 6.12% ✓ | -0.03 pt | 5/5 | 3,516 |
| wk of Feb 2, 23 | Feb 2, 2023 | 6.15% | 6.09% | 6.09% ✓ | -0.06 pt | 4/5 | 4,127 |
| wk of Jan 26, 23 | Jan 26, 2023 | 6.21% | 6.13% | 6.13% ✓ | -0.08 pt | 4/5 | 3,353 |
| wk of Jan 19, 23 | Jan 19, 2023 | 6.16% | 6.15% | 6.15% ✓ | -0.01 pt | 4/4 | 7,056 |
| wk of Jan 12, 23 | Jan 12, 2023 | 6.25% | 6.33% | 6.33% ✓ | +0.08 pt | 9/10 | 21,487 |
| wk of Jan 5, 23 | Jan 5, 2023 | 6.49% | 6.48% | 6.48% ✓ | -0.01 pt | 5/5 | 9,042 |
| wk of Dec 29, 22 | Dec 29, 2022 | 6.30% | 6.42% | 6.42% ✓ | market median outside listed strikes | 10/10 | 510 |
| wk of Dec 22, 22 | Dec 22, 2022 | 6.32% | 6.27% | 6.27% ✓ | -0.05 pt | 7/8 | 21,644 |
Highlighted rows missed by more than 0.10 pt. Official values: Freddie Mac PMMS 30-year fixed rate as first published (via ALFRED/FRED series MORTGAGE30US).
Download the data
Release-by-release scorecard (CSV)
One row per settled Kalshi event: the market median 24 hours before, Kalshi’s settlement value, the official first-release value and the miss. Per-contract prices are not included. Free to reuse under CC BY 4.0 with a link back to this page.
Embed this chart
Methodology
- Markets. Kalshi’s weekly 30-year mortgage rate series (
FRM-events, now listed underKXFRM), each a ladder of “above X%” contracts on the Freddie Mac Primary Mortgage Market Survey rate published that Thursday, from Kalshi’s public API. Weeks where fewer than two contracts had a price are not scored. - Official data. Freddie Mac Primary Mortgage Market Survey® (PMMS) 30-year fixed rate, as first published, via FRED/ALFRED series MORTGAGE30US. Source: Freddie Mac. PMMS is a registered trademark of Freddie Mac; Freddie Mac does not endorse this analysis.
- Market median. For each release we take every “above X” contract’s price 24 hours before trading closed (midpoint of bid and ask from hourly candles when the spread is 10¢ or less, otherwise the last trade; looking back up to 48 hours). Prices are forced to fall as the threshold rises, and the median is the point where the implied chance crosses 50%, interpolated between neighboring thresholds. If the 50% point falls outside the listed thresholds the release is shown but not scored.
- Contracts called right. Each threshold contract counts once: right if the side priced above 50¢ a day before won. Contracts priced exactly 50¢ are skipped.
- Actual value. The value Kalshi settled on (its “expiration value”), which follows the first official release. We check it against the first-release value in ALFRED (St. Louis Fed’s archive of data as first published) and mark any difference.
- Limits. One exchange; thin trading in some older and far-out contracts; the market median is a summary of a full distribution, not a single forecast. Nothing here is investment advice. Last run: Oct 12, 2026, 10:04 AM ET.
Cite this research
Suggested citation: PredictionScout. (2026, October 12). How Accurate Were Prediction Markets on Mortgage Rates? Kalshi vs. Freddie Mac. https://predictionscout.com/research/mortgage-rate-prediction-market-accuracy/
For a chart or news story: “Source: PredictionScout analysis of public exchange data (https://predictionscout.com/research/mortgage-rate-prediction-market-accuracy/)”
The data and charts on this page are free to reuse under CC BY 4.0 with a link back to this page. Market data: Kalshi. Mortgage rates: Freddie Mac Primary Mortgage Market Survey (via FRED).
Data sources: prices and volumes come from the public APIs of Kalshi and Polymarket, with mortgage-rate data from Freddie Mac PMMS. All trademarks belong to their owners. PredictionScout is independent and not affiliated with any exchange. Nothing here is investment, betting, or legal advice.
Related: GDP scorecard · Fed dot plot vs markets · All research