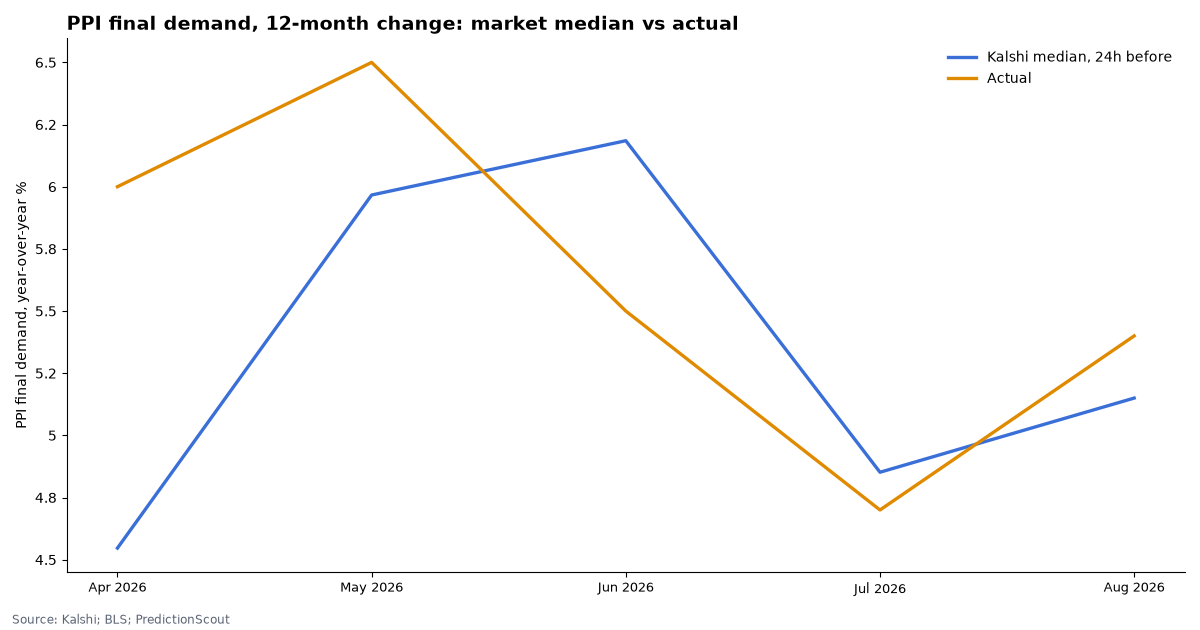
Kalshi’s PPI markets missed the BLS 12-month number by a median 0.53 points over 5 releases.
Kalshi has listed Producer Price Index markets only since spring 2026, so the record is short. A day before each BLS release, we compare the market’s median with the number BLS first published, and check every Kalshi settlement against BLS. For the next release, the market median for the 12-month change is 5.2%.
Kalshi market data and official statistics, pulled Oct 15, 2026, 7:54 AM ET. Updated daily.
By Arthur Angelo, PredictionScout Research · Updated Oct 15, 2026, 7:54 AM ET
Key findings
- 12-month change: median miss 0.53 points. Over 5 releases, PPI came in above the market median 3 times and below it 2 times. Threshold contracts went the way the market leaned 61 of 81 times (75%).
- Monthly change: only 1 scored release. Median miss 0.91 points; 10 of 15 threshold contracts went the way the market leaned. The monthly series has few settled events, so treat this as anecdotal.
- Biggest 12-month miss: Apr 2026. Market median 4.55%, BLS 6.0%.
- Settlement check. 6 of 6 scored Kalshi settlements match the BLS first-published value.
PPI final demand, 12-month change
Next release: PPI YoY in September
Trading closes Thursday, October 15, 2026, 8:29 AM ET. Market median right now: 5.2%. 8,268 contracts traded so far. As of Oct 15, 2026, 7:54 AM ET. Market on Kalshi.
| Contract | Implied chance |
|---|---|
| Above 4.8% | 93% |
| Above 4.9% | 83% |
| Above 5.0% | 85% |
| Above 5.1% | 77% |
| Above 5.2% | 29% |
| Above 5.3% | 92% |
| Above 5.4% | 50% |
| Above 5.5% | 60% |
| Above 5.6% | 94% |
| Above 5.7% | 37% |
| Above 5.8% | 18% |
| Above 5.9% | 7% |
Across 5 releases from May 13, 2026 to Sep 10, 2026, the market’s median a day before was off by 0.53 pt in a typical release (median miss) and 0.61 pt on average. The number came in above the market median 3 times and below it 2 times. Of 81 individual “above X” contracts, the side priced above 50¢ a day out was right 61 times (75%).
| Period | Released | Market median 24h before | Actual (Kalshi settlement) | Official first release | Actual minus median | Contracts called right | Contracts traded |
|---|---|---|---|---|---|---|---|
| Aug 2026 | Sep 10, 2026 | 5.2% | 5.4% | 5.4% ✓ | +0.25 pt | 13/15 | 16,609 |
| Jul 2026 | Aug 13, 2026 | 4.9% | 4.7% | 4.7% ✓ | -0.15 pt | 22/24 | 21,910 |
| Jun 2026 | Jul 15, 2026 | 6.2% | 5.5% | 5.5% ✓ | -0.69 pt | 12/18 | 29,164 |
| May 2026 | Jun 11, 2026 | 6.0% | 6.5% | 6.5% ✓ | +0.53 pt | 8/12 | 36,376 |
| Apr 2026 | May 13, 2026 | 4.5% | 6.0% | 6.0% ✓ | +1.45 pt | 6/12 | 23,190 |
Highlighted rows missed by more than 0.30 pt. Official values: BLS Producer Price Index for final demand, not seasonally adjusted, 12-month change as first published (ALFRED series PPIFID), rounded to 0.1.
PPI final demand, monthly change
Next release: PPI MoM in September
Trading closes Thursday, October 15, 2026, 8:29 AM ET. Market median right now: -0.3% (outside the listed range). 901 contracts traded so far. As of Oct 15, 2026, 7:54 AM ET. Market on Kalshi.
| Contract | Implied chance |
|---|---|
| Above 0.1% | 98% |
| Above 0.2% | 24% |
| Above 0.3% | 97% |
| Above 0.4% | 95% |
| Above 0.5% | 85% |
| Above 0.6% | 75% |
| Above 0.7% | 87% |
| Above 0.8% | 14% |
| Above 0.9% | 23% |
Across 1 releases from May 13, 2026 to May 13, 2026, the market’s median a day before was off by 0.91 pt in a typical release (median miss) and 0.91 pt on average. The number came in above the market median 1 times and below it 0 times. Of 15 individual “above X” contracts, the side priced above 50¢ a day out was right 10 times (67%).
| Period | Released | Market median 24h before | Actual (Kalshi settlement) | Official first release | Actual minus median | Contracts called right | Contracts traded |
|---|---|---|---|---|---|---|---|
| Apr 2026 | May 13, 2026 | 0.5% | 1.4% | 1.4% ✓ | +0.91 pt | 10/15 | 56,455 |
Highlighted rows missed by more than 0.30 pt. Official values: BLS Producer Price Index for final demand, seasonally adjusted, monthly change as first published (ALFRED series PPIFIS), rounded to 0.1.
Download the data
Release-by-release scorecard (CSV)
One row per settled Kalshi event: the market median 24 hours before, Kalshi’s settlement value, the official first-release value and the miss. Per-contract prices are not included. Free to reuse under CC BY 4.0 with a link back to this page.
Embed this chart
Methodology
- Markets. Kalshi’s
KXUSPPIYOY(12-month change) andKXUSPPI(monthly change) series: ladders of “above X%” contracts on the Producer Price Index for final demand, from Kalshi’s public API. Both series started in 2026, so the sample is small. - Official data. BLS Producer Price Index news release. First-published values come from ALFRED (St. Louis Fed): PPIFID (not seasonally adjusted, used for the 12-month change, as BLS reports it) and PPIFIS (seasonally adjusted, used for the monthly change), rounded to 0.1. BLS revises PPI for four months after first release; markets settle on the first number.
- Market median. For each release we take every “above X” contract’s price 24 hours before trading closed (midpoint of bid and ask from hourly candles when the spread is 10¢ or less, otherwise the last trade; looking back up to 48 hours). Prices are forced to fall as the threshold rises, and the median is the point where the implied chance crosses 50%, interpolated between neighboring thresholds. If the 50% point falls outside the listed thresholds the release is shown but not scored.
- Contracts called right. Each threshold contract counts once: right if the side priced above 50¢ a day before won. Contracts priced exactly 50¢ are skipped.
- Actual value. The value Kalshi settled on (its “expiration value”), which follows the first official release. We check it against the first-release value in ALFRED (St. Louis Fed’s archive of data as first published) and mark any difference.
- Limits. One exchange; thin trading in some older and far-out contracts; the market median is a summary of a full distribution, not a single forecast. Nothing here is investment advice. Last run: Oct 15, 2026, 7:54 AM ET.
Cite this research
Suggested citation: PredictionScout. (2026, October 15). How Accurate Are Prediction Markets on Producer Prices? Kalshi PPI Markets vs. BLS. https://predictionscout.com/research/ppi-prediction-market-accuracy/
For a chart or news story: “Source: PredictionScout analysis of public exchange data (https://predictionscout.com/research/ppi-prediction-market-accuracy/)”
The data and charts on this page are free to reuse under CC BY 4.0 with a link back to this page. Market data: Kalshi. PPI: U.S. Bureau of Labor Statistics via ALFRED.
Data sources: prices and volumes come from the public APIs of Kalshi and Polymarket, with producer price data from the Bureau of Labor Statistics. All trademarks belong to their owners. PredictionScout is independent and not affiliated with any exchange. Nothing here is investment, betting, or legal advice.
Related: CPI scorecard · core PCE scorecard · egg prices · All research