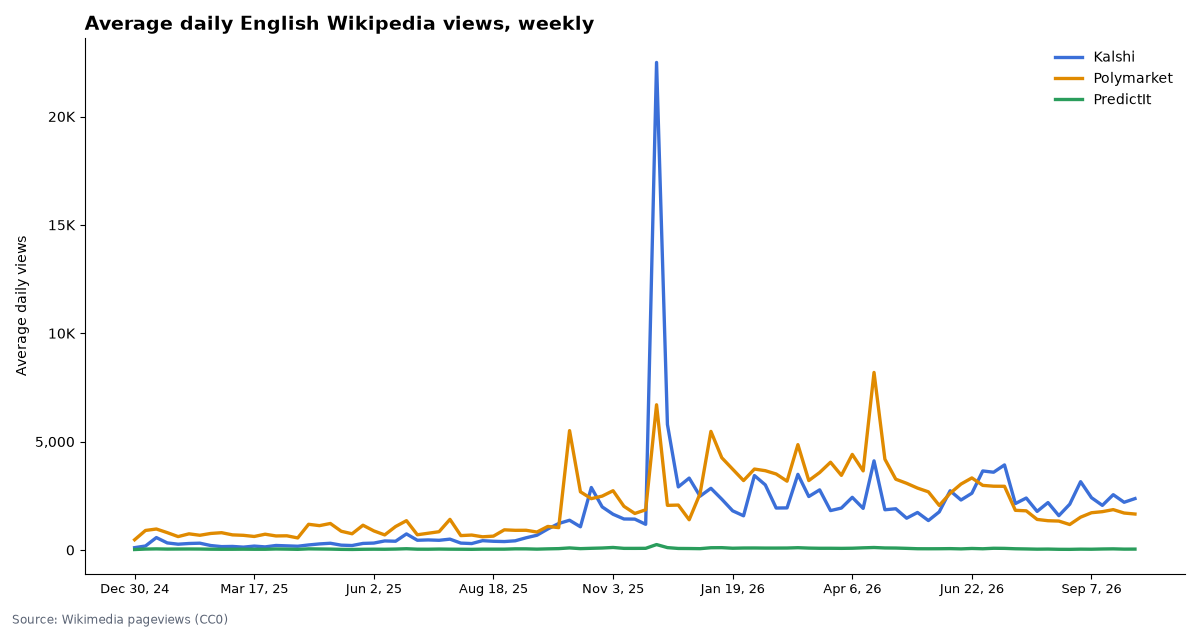
Kalshi’s Wikipedia page drew 17,087 views in the last 7 days, against 10,702 for Polymarket.
A simple public measure of attention: how many people open each platform’s English Wikipedia article. Daily counts since January 2025, with weekly averages charted.
Source: Wikimedia pageviews API (CC0); human traffic only. Latest full day: Oct 14, 2026. Updated daily. Checked Oct 15, 2026, 7:50 AM ET.
By Arthur Angelo, PredictionScout Research · Updated Oct 15, 2026, 7:50 AM ET
Key findings
- Last 7 days (through Oct 14, 2026): Kalshi 17,087 views, Polymarket 10,702, PredictIt 312, “Prediction market” 3,950.
- Versus four weeks earlier. Kalshi +7%, Polymarket -13%, PredictIt +1%, Prediction market -4%. Versus the same week a year earlier: Kalshi +83%, Polymarket -69%, PredictIt -47%.
- Busiest days since January 2025. Kalshi: 40,767 views on Dec 4, 2025; Polymarket: 20,675 views on Dec 1, 2025; PredictIt: 370 views on Dec 4, 2025; Prediction market: 6,687 views on Aug 6, 2026. Pageviews show how many people opened an article, not why.
Average daily pageviews, by week
Share of the four pages
Last 21 days
| Date | Kalshi | Polymarket | PredictIt | Prediction market |
|---|---|---|---|---|
| Oct 14, 2026 | 2,670 | 1,448 | 62 | 509 |
| Oct 13, 2026 | 2,628 | 1,498 | 59 | 569 |
| Oct 12, 2026 | 2,519 | 2,096 | 42 | 593 |
| Oct 11, 2026 | 2,243 | 1,209 | 40 | 472 |
| Oct 10, 2026 | 1,984 | 1,252 | 35 | 450 |
| Oct 9, 2026 | 2,093 | 1,470 | 32 | 640 |
| Oct 8, 2026 | 2,950 | 1,729 | 42 | 717 |
| Oct 7, 2026 | 2,467 | 1,834 | 42 | 560 |
| Oct 6, 2026 | 2,320 | 1,844 | 54 | 506 |
| Oct 5, 2026 | 2,550 | 2,281 | 49 | 692 |
| Oct 4, 2026 | 2,400 | 2,867 | 28 | 656 |
| Oct 3, 2026 | 2,127 | 1,836 | 31 | 554 |
| Oct 2, 2026 | 2,037 | 1,334 | 48 | 550 |
| Oct 1, 2026 | 2,215 | 1,340 | 42 | 472 |
| Sep 30, 2026 | 2,260 | 1,500 | 48 | 549 |
| Sep 29, 2026 | 2,070 | 1,472 | 46 | 522 |
| Sep 28, 2026 | 2,308 | 1,594 | 41 | 479 |
| Sep 27, 2026 | 2,205 | 1,419 | 31 | 411 |
| Sep 26, 2026 | 2,367 | 1,529 | 38 | 518 |
| Sep 25, 2026 | 3,444 | 1,907 | 54 | 633 |
| Sep 24, 2026 | 3,372 | 2,716 | 64 | 594 |
Download the data
Daily Wikipedia pageviews (CSV)
One row per day since January 2025; counts are human (user) views. Free to reuse under CC BY 4.0 with a link back to this page.
Embed this chart
Methodology
- Data. Wikimedia Foundation pageviews REST API, per-article daily counts on en.wikipedia.org, access = all, agent = user (automated traffic excluded). Wikimedia data is released under CC0. Articles: Kalshi, Polymarket, PredictIt and Prediction market.
- Limits. Wikipedia views are one signal of attention and are affected by search-engine placement, news links and article edits. They do not measure trading, users or interest on other sites. Counts for the latest day can be revised slightly.
- Compare with trading data on the statistics page and app rankings on the app store tracker.
Cite this research
Suggested citation: PredictionScout. (2026, October 15). Prediction Market Attention Index: Wikipedia Pageviews for Kalshi, Polymarket and PredictIt. https://predictionscout.com/research/prediction-market-attention-index/
For a chart or news story: “Source: PredictionScout analysis of public exchange data (https://predictionscout.com/research/prediction-market-attention-index/)”
The data and charts on this page are free to reuse under CC BY 4.0 with a link back to this page.
Data sources: prices and volumes come from the public APIs of Kalshi and Polymarket, the Wikimedia Foundation. All trademarks belong to their owners. PredictionScout is independent and not affiliated with any exchange. Nothing here is investment, betting, or legal advice.