Kalshi’s gas-price market has priced within 0.5¢ of the official AAA number a day before settlement; its TSA market within 9K people a day.
Some prediction markets settle on a government or agency number that anyone can check. This page compares what Kalshi traders expected with what the official source later reported, for TSA screenings, the US gas price and New York’s daily high.
Official data from TSA, EIA and the National Weather Service; markets from Kalshi. Updated daily. Checked Oct 15, 2026, 7:50 AM ET.
By Arthur Angelo, PredictionScout Research · Updated Oct 15, 2026, 7:50 AM ET
Key findings
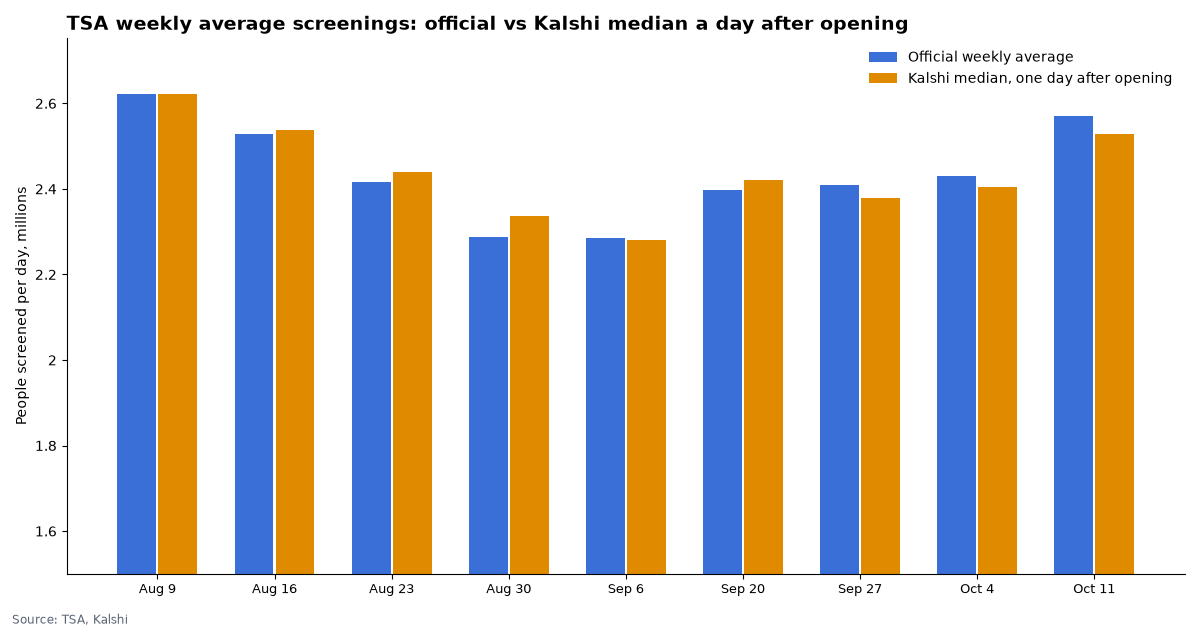
- TSA travel. Kalshi’s implied median for the weekly average number of people screened by the TSA was off by 23,460 on average about a week before the week ended (a day after the market opened) and 9,035 a day before, across the last 9 settled weeks (average screenings run about 2.44 million a day). Repeating the previous week’s figure would have missed by 77,657.
- Gas prices. For the weekly “US gas prices” market, Kalshi’s implied median was off by 3.2¢ about a week before settlement (a day after the market opened) and 0.5¢ a day before (10 weeks). Repeating the previous week’s price would have missed by 7.0¢. The market settles on AAA’s price; the EIA’s own weekly price for the same Monday differed from it by 1.0¢ on average.
- New York weather. Weighting each temperature bracket by its Kalshi price about 11 hours before the day began gave an expected high that was 1.0°F from Central Park’s official high on average over 14 days. The expected high was above the official high on 11 of 14 days. The National Weather Service climate report matched Kalshi’s settlement value on 7 of 7 days it was available.
- New York snowfall. Kalshi’s monthly snowfall markets settled in line with NOAA’s official Central Park monthly total in 13 of 15 months since December 2022. The snowiest month in the sample was February 2026, at 22.3 inches.
- This week’s TSA market (TSA avg check-ins from Oct 12 to 18, 2026?): Kalshi’s median is 2,624,790. The TSA has published 2 of 7 days so far, averaging 2,591,348 (latest: Oct 13, 2,353,356).
- Next gas settlement (US gas prices this week): Kalshi’s median is $4.312. The EIA’s latest weekly US regular price was $4.331 for Oct 12.
TSA checkpoint travel: Kalshi vs the TSA
| Week ending | Official weekly average | Kalshi median, one day after opening | Kalshi median, 1 day before close | Miss, one day after opening |
|---|---|---|---|---|
| Oct 11, 2026 | 2,571,565 | 2,528,000 | 2,560,891 | -43,565 |
| Oct 4, 2026 | 2,431,221 | 2,404,255 | 2,421,154 | -26,966 |
| Sep 27, 2026 | 2,409,972 | 2,379,085 | 2,419,521 | -30,887 |
| Sep 20, 2026 | 2,397,613 | 2,420,238 | 2,406,667 | +22,625 |
| Sep 6, 2026 | 2,285,918 | 2,280,660 | 2,291,818 | -5,258 |
| Aug 30, 2026 | 2,287,499 | 2,335,537 | 2,298,958 | +48,038 |
| Aug 23, 2026 | 2,415,861 | 2,440,000 | 2,420,122 | +24,139 |
| Aug 16, 2026 | 2,528,105 | 2,537,255 | 2,548,000 | +9,150 |
| Aug 9, 2026 | 2,621,528 | 2,621,014 | 2,621,988 | -514 |
Gas prices: Kalshi (AAA) vs the EIA
Kalshi’s weekly gas market settles on AAA’s national average regular price on Mondays. The U.S. Energy Information Administration (EIA) publishes its own weekly retail price for the same Mondays, so the two can be compared.
| Monday | AAA (Kalshi settlement) | EIA weekly price | AAA minus EIA | Kalshi median, one day after opening | Kalshi median, 1 day before close |
|---|---|---|---|---|---|
| Oct 12, 2026 | $4.356 | $4.331 | +2.5¢ | $4.353 | $4.356 |
| Oct 5, 2026 | $4.365 | $4.354 | +1.1¢ | $4.374 | $4.370 |
| Sep 28, 2026 | $4.477 | $4.465 | +1.2¢ | $4.478 | $4.480 |
| Sep 21, 2026 | $4.479 | $4.478 | +0.1¢ | $4.427 | $4.486 |
| Sep 14, 2026 | $4.316 | $4.319 | -0.3¢ | $4.161 | $4.324 |
| Sep 7, 2026 | $4.151 | $4.157 | -0.6¢ | $4.079 | $4.145 |
| Aug 31, 2026 | $4.081 | $4.071 | +1.0¢ | $4.075 | $4.075 |
| Aug 24, 2026 | $4.099 | $4.085 | +1.4¢ | $4.097 | $4.097 |
| Aug 17, 2026 | $4.064 | $4.049 | +1.5¢ | $4.082 | $4.066 |
| Aug 10, 2026 | $4.009 | $4.006 | +0.3¢ | $4.007 | $4.001 |
New York City daily high: Kalshi vs the National Weather Service
| Date | Official high (°F) | NWS climate report (°F) | Kalshi expected high (°F) | Miss |
|---|---|---|---|---|
| Oct 14, 2026 | 77 | 77 | 78.0 | +1.0 |
| Oct 13, 2026 | 71 | 71 | 70.8 | -0.2 |
| Oct 12, 2026 | 70 | 70 | 71.0 | +1.0 |
| Oct 11, 2026 | 60 | 60 | 61.4 | +1.4 |
| Oct 10, 2026 | 69 | 69 | 68.3 | -0.7 |
| Oct 9, 2026 | 70 | 70 | 70.9 | +0.9 |
| Oct 8, 2026 | 73 | 73 | 74.0 | +1.0 |
| Oct 7, 2026 | 65 | — | 66.2 | +1.2 |
| Oct 6, 2026 | 60 | — | 62.4 | +2.4 |
| Oct 5, 2026 | 68 | — | 69.7 | +1.7 |
| Oct 4, 2026 | 62 | — | 62.7 | +0.7 |
| Oct 3, 2026 | 70 | — | 71.2 | +1.2 |
| Oct 2, 2026 | 83 | — | 83.6 | +0.6 |
| Oct 1, 2026 | 76 | — | 75.8 | -0.2 |
New York City snowfall: Kalshi vs NOAA’s Central Park record
Kalshi’s monthly snowfall markets settle on the total measured in Central Park. We compare each settlement with NOAA’s official monthly total.
| Month | Kalshi settlement (in.) | NOAA Central Park (in.) | Match | Contracts traded |
|---|---|---|---|---|
| Mar 2026 | at most 0.1 | trace | ✓ | 334,202 |
| Feb 2026 | 22.3 | 22.3 | ✓ | 2,772,569 |
| Jan 2026 | 13.9 | 13.9 | ✓ | 2,305,632 |
| Dec 2025 | 7.2 | 7.2 | ✓ | 1,193,525 |
| Feb 2025 | 7.1 | 7.1 | ✓ | 468,142 |
| Dec 2024 | 2.8 | 2.8 | ✓ | 144,246 |
| Mar 2024 | 0.0 | trace | ✓ | 87,978 |
| Feb 2024 | 5.2 | 5.2 | ✓ | 261,552 |
| Jan 2024 | 2.3 | 2.3 | ✓ | 240,381 |
| Dec 2023 | 0.0 | trace | ✓ | 11,740 |
| Nov 2023 | 0.5 | trace | differs | 81 |
| Mar 2023 | 0.0 | 0.1 | differs | 5,691 |
| Feb 2023 | 2.2 | 2.2 | ✓ | 12,321 |
| Jan 2023 | 0.0 | trace | ✓ | 5,011 |
| Dec 2022 | 0.0 | trace | ✓ | 2,264 |
NOAA reports a trace (less than 0.1 inch) as “T”; we treat it as zero, as the markets do. Kalshi’s older series (SNOWNYM/KXSNOWNYM) and newer one (KXNYCSNOWM) are combined.
Daily high temperatures in six more cities: Kalshi vs. the National Weather Service
Kalshi lists daily high-temperature brackets (usually 2°F wide) for Chicago, Miami, Austin, Philadelphia, Denver and Los Angeles, each tied to one NWS climate station. For the latest 60 settled days in each city, we took bracket prices on the morning before the day (about 18 hours before trading closed) and checked each settlement against the official daily maximum. Across 360 city-days, the favorite bracket won 190 times (53%); it did best in Denver (62%) and worst in Chicago (Midway) (43%). 359 of 360 Kalshi settlements match the NWS figure exactly.
| City (NWS station) | Days scored | Favorite bracket won | Favorite’s average chance | Winning bracket’s average chance | Settlement = NWS high | Contracts traded |
|---|---|---|---|---|---|---|
| Chicago (Midway) | 60 | 26 (43%) | 51% | 38% | 60 of 60 | 6,234,382 |
| Miami | 60 | 27 (45%) | 53% | 38% | 59 of 60 | 10,405,231 |
| Austin | 60 | 34 (57%) | 55% | 43% | 60 of 60 | 4,254,320 |
| Philadelphia | 60 | 31 (52%) | 51% | 37% | 60 of 60 | 2,673,019 |
| Denver | 60 | 37 (62%) | 52% | 42% | 60 of 60 | 2,616,648 |
| Los Angeles (LAX) | 60 | 35 (58%) | 54% | 43% | 60 of 60 | 34,194,740 |
Differences: Miami Aug 29, 2026: Kalshi 90°F, NWS 85°F. Kalshi’s rules name The Weather Company as the data provider for the NWS climate report; NWS figures can be corrected after the first report.
Stations: Chicago Midway (CLIMDW), Miami (CLIMIA), Austin-Bergstrom (CLIAUS), Philadelphia (CLIPHL), Denver (CLIDEN), Los Angeles (CLILAX). Official highs from NOAA’s Applied Climate Information System (RCC-ACIS).
Download the data
TSA (CSV)Gas prices (CSV)NYC weather (CSV)NYC snowfall (CSV)Six-city daily highs (CSV)
Each file has one row per settled market period. Free to reuse under CC BY 4.0 with a link back to this page.
Embed this chart
Methodology
- Markets. Kalshi series KXTSAW (weekly average TSA screenings), KXAAAGASW (weekly US gas price) and KXHIGHNY (NYC daily high), most recent settled events. “Implied median” is where the interpolated “above X” price ladder crosses 50%, using hourly bid/ask midpoints taken one day after the market opened (about a week before it closed) and one day before it closed (a strike with no price in the prior three days is skipped, and at least five strikes are needed).
- Official numbers. The settlement value recorded by Kalshi. We cross-check them against independent sources: the TSA’s published daily screenings (tsa.gov), the EIA weekly US regular retail gasoline price (series EMM_EPMR_PTE_NUS_DPG, EIA Open Data), and the NWS Central Park climate report (CLINYC). AAA’s own price page is not republished here; its values appear only as Kalshi settled them.
- Snowfall. Kalshi monthly NYC snowfall series KXSNOWNYM and KXNYCSNOWM (“above X inches” ladders). Official totals from NOAA’s Applied Climate Information System for station NY City Central Park (RCC-ACIS). Where Kalshi did not record a value, the settled range is read from which “above X” contracts paid out.
- Weather. Kalshi lists temperature brackets, so we weight each bracket’s midpoint by its price (open-ended brackets use a point 1.5°F beyond the edge) at about 11 AM ET the day before. This is an expected value, not a median.
- Misses. Averages of absolute differences, so over- and under-estimates do not cancel. Samples are small (about 12 weeks or 14 days) and change as markets settle; treat them as descriptions, not as a measure of long-run accuracy. See our larger accuracy scorecard.
Cite this research
Suggested citation: PredictionScout. (2026, October 15). Prediction Markets vs. the Official Numbers: TSA Travel, Gas Prices, NYC Weather and Snowfall. https://predictionscout.com/research/prediction-markets-vs-official-numbers/
For a chart or news story: “Source: PredictionScout analysis of public exchange data (https://predictionscout.com/research/prediction-markets-vs-official-numbers/)”
The data and charts on this page are free to reuse under CC BY 4.0 with a link back to this page.
Data sources: prices and volumes come from the public APIs of Kalshi and Polymarket, the TSA, EIA and National Weather Service. All trademarks belong to their owners. PredictionScout is independent and not affiliated with any exchange. Nothing here is investment, betting, or legal advice.