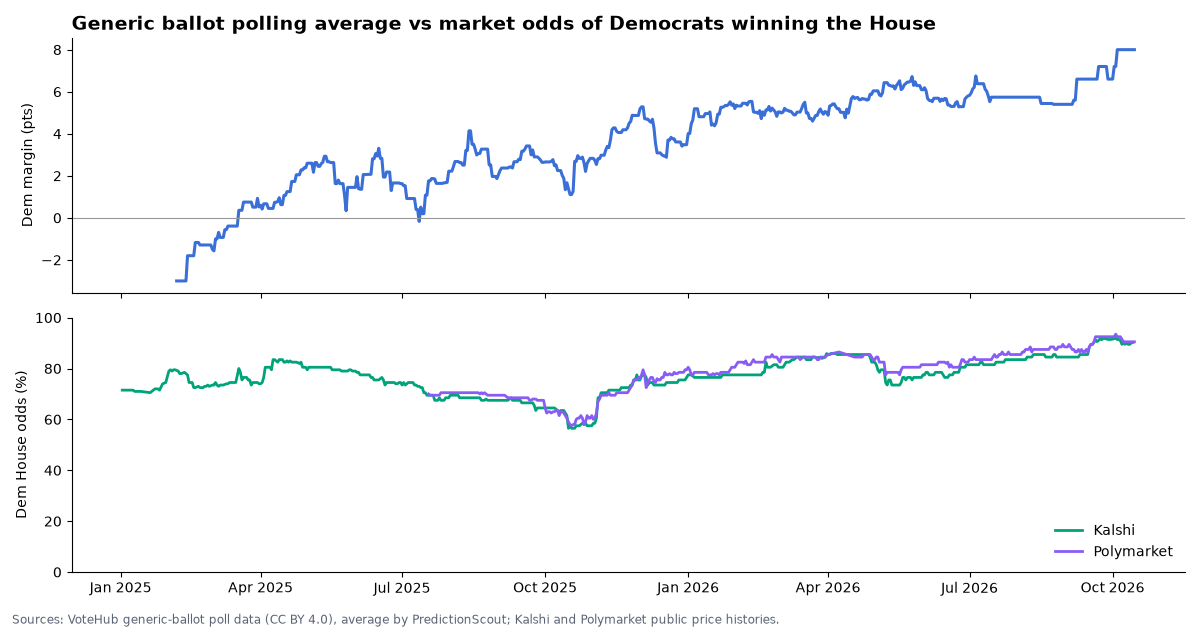
Polls show Democrats ahead by 8.0 points on the generic ballot. Markets give them a 90% chance of winning the House.
Generic-ballot average of the latest poll from each of 5 pollsters (as of October 15, 2026), against Kalshi (90.2%) and Polymarket (90.5%) prices for Democrats winning the House. Both have moved toward Democrats since early 2025, but not in lockstep.
Updated daily until Election Day, November 3, 2026. Latest update Oct 15, 2026, 7:46 AM ET.
By Arthur Angelo, PredictionScout Research · Updated Oct 15, 2026, 7:46 AM ET
Key findings
- Both rose over the cycle. On February 7, 2025 the polling average was R+3.0 and Kalshi had Democrats at 79% to win the House. By October 14, 2026 polls were at D+8.0 and Kalshi at 90.2% (Polymarket 90.5%).
- Markets favored Democrats even when polls did not. On the 33 days when the polling average showed Republicans ahead (early 2025), Kalshi still priced a Democratic House at 72–79%. The party out of the White House has gained House seats in most midterms, which may be part of what traders were pricing in.
- Day to day, the link is loose. The correlation between the daily polling margin and the market price is 0.51 for Kalshi (606 days since February 2025) and 0.87 for Polymarket (from July 2025). Average Kalshi price by polling margin: Republicans ahead: 74% (33 days); D+0 to D+2: 75% (104 days); D+2 to D+4: 70% (153 days); D+4 to D+6: 80% (237 days); D+6 or more: 83% (79 days). The market fell to its low of 56.5% on October 16, 2025 while polls showed D+1.4.
- Fewer polls in the record lately. Our poll source lists 208 generic-ballot polls ending January–June 2026 but only 10 since July 1 (after removing internal and partisan polls and duplicates). When fewer than 5 pollsters have a poll in the last 28 days, we widen the window, so the recent average rests on older and fewer polls (the current window is 38 days). Other averages that include more polls may differ.
Polls and odds, day by day
The most recent polls
Each poll links to the pollster’s own release. LV = likely voters, RV = registered voters, A = adults; when a poll reports more than one, we use likely voters first, then registered voters.
| Field end | Pollster | Pop. | Sample | Dem | Rep | Margin |
|---|---|---|---|---|---|---|
| 2026-10-04 | Pew Research Center | RV | 3,917 | 44% | 36% | D+8.0 |
| 2026-10-02 | YouGov – CBS News | LV | 1,572 | 54% | 45% | D+9.0 |
| 2026-09-28 | HarrisX/Harris for Harvard University Center for American Political Studies | LV | — | 51% | 49% | D+2.0 |
| 2026-09-22 | The Argument/Verasight | LV | — | 55% | 45% | D+10.0 |
| 2026-09-08 | YouGov for The Economist | LV | 1,015 | 49% | 38% | D+11.0 |
| 2026-09-06 | Morning Consult | RV | 2,203 | 46% | 42% | D+4.0 |
| 2026-08-24 | Ipsos for Reuters | RV | 951 | 41% | 35% | D+6.0 |
| 2026-08-24 | YouGov for The Economist | RV | 1,377 | 46% | 40% | D+6.0 |
| 2026-08-16 | Noble Predictive Insights for The Center Square | RV | 2,533 | 47% | 42% | D+5.0 |
| 2026-07-12 | Morning Consult | RV | 24,000 | 46% | 43% | D+3.0 |
| 2026-06-30 | Focaldata for Financial Times | RV | 1,795 | 50% | 43% | D+7.0 |
| 2026-06-29 | YouGov for The Economist | RV | 1,426 | 45% | 42% | D+3.0 |
| 2026-06-28 | Big Data Poll for Public Polling Project | LV | 2,604 | 50% | 41% | D+9.2 |
| 2026-06-22 | YouGov for The Economist | RV | 1,517 | 45% | 43% | D+2.0 |
| 2026-06-22 | Ipsos | RV | 978 | 41% | 36% | D+5.0 |
| 2026-06-22 | Echelon Insights | LV | 1,003 | 51% | 45% | D+6.0 |
| 2026-06-22 | Verasight for Strength in Numbers | RV | 1,896 | 50% | 43% | D+7.0 |
| 2026-06-22 | Morning Consult | RV | — | 46% | 42% | D+4.0 |
| 2026-06-17 | Quantus Insights | LV | 1,000 | 47% | 43% | D+4.0 |
| 2026-06-16 | The Bullfinch Group for The Independent Center | RV | 1,000 | 44% | 36% | D+8.0 |
| 2026-06-15 | Ipsos for Reuters | RV | 1,195 | 41% | 38% | D+3.0 |
| 2026-06-15 | YouGov for The Economist | RV | 1,402 | 46% | 44% | D+2.0 |
| 2026-06-15 | Marquette University Law School | LV | 827 | 53% | 45% | D+8.0 |
| 2026-06-14 | Echelon Insights | LV | 1,012 | 50% | 44% | D+6.0 |
| 2026-06-14 | Morning Consult | RV | 24,000 | 46% | 42% | D+3.9 |
Download the data
Daily polling average and market prices (CSV)
One row per day since January 1, 2025: polling average (Democratic and Republican share, margin, number of pollsters, window), Kalshi and Polymarket prices. A second section lists every poll used, with its source link. Free to reuse under CC BY 4.0; please also credit VoteHub for the poll data.
Embed this chart
Methodology
- Polls. National generic congressional ballot polls for 2026 from the VoteHub polls API, which is published under CC BY 4.0. Each poll in the database links to its original release. We drop polls VoteHub marks as internal or partisan-sponsored. 397 polls from 72 pollsters remain.
- The average. For each day, the latest poll from each pollster whose fieldwork ended in the previous 28 days, so prolific pollsters don’t dominate. If fewer than 5 pollsters qualify, the window is widened a day at a time, up to 90 days. A simple average of the Democratic-minus-Republican margin, with no house-effect or quality adjustments. This is a plain average for comparison, not a forecast.
- Markets. Kalshi’s “Which party will win the U.S. House?” market (CONTROLH-2026, Democratic contract): daily close, bid/ask midpoint when the spread is 10¢ or less, otherwise the last trade. Polymarket’s “Which party will win the House in 2026?” (Democratic Party): its public daily price history.
- Correlation is between the daily polling margin and the daily market price on days with both. Both series drift over time, so a high correlation shows they moved in the same direction; it does not show that one caused the other.
- Why they differ. House control depends on district-level races, redistricting and turnout, not just the national popular vote, so the same polling lead can map to different odds. Markets also react to news, special elections and fundraising data between polls.
Cite this research
Suggested citation: PredictionScout. (2026, October 15). Polls vs Prediction Markets: Generic Ballot vs House Control Odds (2026). https://predictionscout.com/research/generic-ballot-polls-vs-prediction-markets/
For a chart or news story: “Source: PredictionScout analysis of public exchange data (https://predictionscout.com/research/generic-ballot-polls-vs-prediction-markets/)”
The data and charts on this page are free to reuse under CC BY 4.0 with a link back to this page. Poll data: VoteHub (CC BY 4.0). Market data: Kalshi and Polymarket public APIs.
Data sources: prices and volumes come from the public APIs of Kalshi and Polymarket, with poll data from VoteHub. All trademarks belong to their owners. PredictionScout is independent and not affiliated with any exchange. Nothing here is investment, betting, or legal advice.
Related research: 2026 midterms tracker · Election-night scorecard · Price gap index · All research