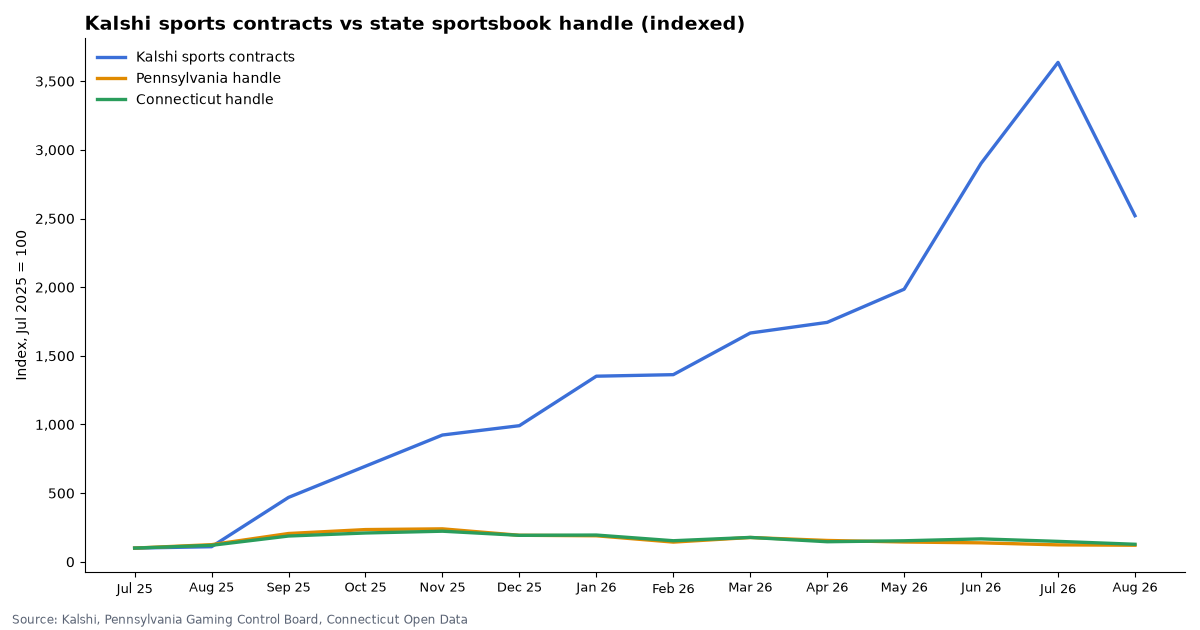
Kalshi sports contracts in markets closed in August 2026: 13.5 billion. Pennsylvania handle: $499 million.
Compared with August 2025: Kalshi sports contracts 23 times the count, Pennsylvania handle -3.3%, Connecticut handle +6.4%. Latest official state data: August 2026.
Updated weekly; state agencies publish about a month after month-end. Checked Oct 11, 2026, 1:55 PM ET.
By Arthur Angelo, PredictionScout Research · Updated Oct 11, 2026, 1:55 PM ET
Key findings
- Kalshi. Sports markets that closed in August 2026 traded 13.51 billion contracts, versus 0.59 billion in markets that closed in August 2025 (23 times as many, a different number of contracts, not dollars). Sports were 96.8% of all Kalshi contracts in markets that closed that month.
- Pennsylvania. Licensed sportsbooks took $498.5 million in wagers in August 2026, -3.3% from August 2025 ($515.4 million). Source: Pennsylvania Gaming Control Board.
- Connecticut. Online sportsbooks took $150.8 million in August 2026, +6.4% from August 2025 ($141.7 million). Source: Connecticut Open Data.
- Different units. Sportsbook handle is dollars wagered. Kalshi publishes contracts, and each contract pays $1 if it wins but is bought at a price of 1¢ to 99¢. A contract count is therefore not a dollar amount, and this page never converts one into the other. The chart compares each series with its own starting level.
Growth since July 2025, each series indexed to its own start
Kalshi sports contracts, by month
Month by month
Kalshi figures are contracts. Pennsylvania and Connecticut figures are dollars wagered. The partial current month is not shown.
| Month | Kalshi sports contracts (billions) | Sports share of Kalshi contracts | Pennsylvania handle | Connecticut handle |
|---|---|---|---|---|
| August 2026 | 13.51 | 97% | $498.5M | $150.8M |
| July 2026 | 19.50 | 97% | $509.5M | $175.7M |
| June 2026 | 15.56 | 96% | $570.3M | $197.1M |
| May 2026 | 10.64 | 96% | $595.6M | $180.8M |
| April 2026 | 9.35 | 96% | $641.6M | $172.5M |
| March 2026 | 8.93 | 92% | $730.9M | $209.6M |
| February 2026 | 7.31 | 90% | $592.5M | $181.2M |
| January 2026 | 7.25 | 92% | $782.4M | $230.0M |
| December 2025 | 5.31 | 93% | $797.4M | $227.6M |
| November 2025 | 4.95 | 93% | $990.6M | $262.9M |
| October 2025 | 3.73 | 96% | $968.5M | $247.6M |
| September 2025 | 2.52 | 94% | $850.5M | $221.6M |
| August 2025 | 0.59 | 94% | $515.4M | $141.7M |
| July 2025 | 0.54 | 82% | $412.5M | $118.0M |
Download the data
Monthly Kalshi contracts and state handle (CSV)
Kalshi columns are contracts; state columns are dollars. Free to reuse under CC BY 4.0 with a link back to this page.
Embed this chart
Methodology
- Kalshi. The
volumefield of every Kalshi market in our market dataset (all categories), summed by the month the market closed, with category = Sports as labeled by Kalshi. The figure is a count of contracts, not a dollar amount, and it counts a market’s whole trading history in its closing month. It covers markets that have already closed, so the current month is incomplete and is left out. Kalshi does not publish sports dollar volume by month in its public API. - Pennsylvania. Pennsylvania Gaming Control Board monthly sports wagering report, grand total of “Handle” (retail and online). The board notes that handle includes wagers on future events.
- Connecticut. Connecticut Open Data (data.ct.gov) online sports wagering dataset, sum of “wagers” across the licensees (CT Lottery Corp, DraftKings, Fanduel), by month ending.
- Comparability. Two states are not the nation, Kalshi’s users are nationwide, and some Kalshi contracts are on events with no sportsbook equivalent. The comparison shows direction of change, not substitution; it does not show that Kalshi customers came from sportsbooks.
- See also: trading costs and the lawsuit tracker for the court fights over sports contracts.
Cite this research
Suggested citation: PredictionScout. (2026, October 11). Kalshi Sports Contracts vs. State Sportsbook Handle (Pennsylvania and Connecticut). https://predictionscout.com/research/kalshi-sports-vs-sportsbook-handle/
For a chart or news story: “Source: PredictionScout analysis of public exchange data (https://predictionscout.com/research/kalshi-sports-vs-sportsbook-handle/)”
The data and charts on this page are free to reuse under CC BY 4.0 with a link back to this page.
Data sources: prices and volumes come from the public APIs of Kalshi and Polymarket, the Pennsylvania Gaming Control Board and Connecticut Open Data. All trademarks belong to their owners. PredictionScout is independent and not affiliated with any exchange. Nothing here is investment, betting, or legal advice.