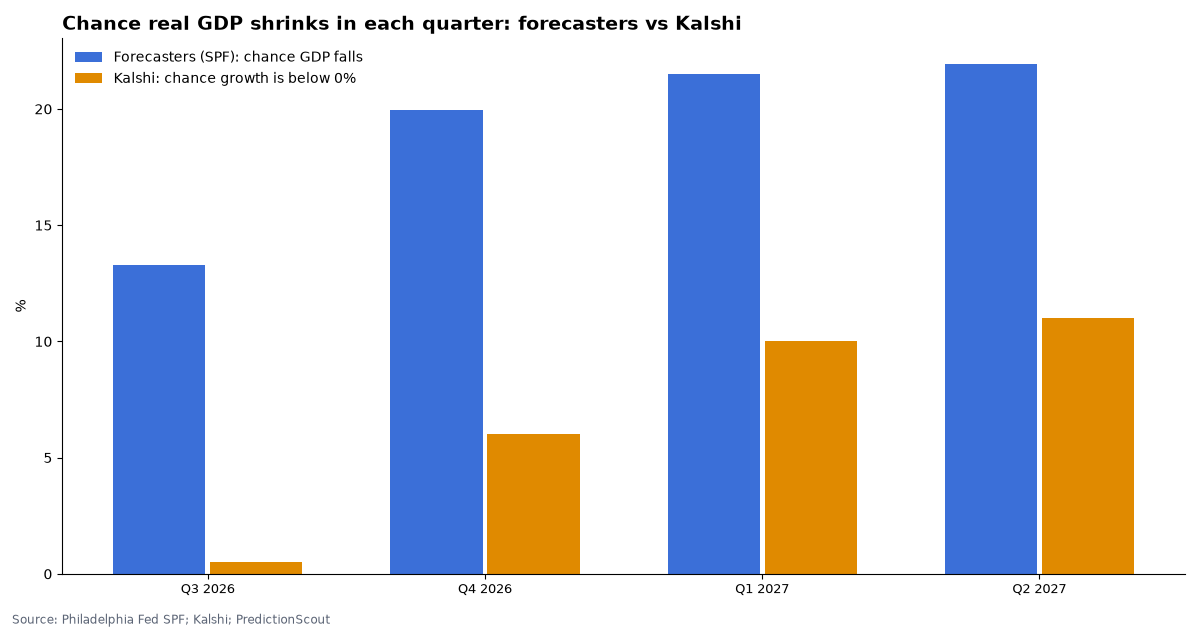
Professional forecasters see a 20% chance the economy shrinks in Q4 2026. Kalshi traders see 6%.
Two ways of measuring recession risk, side by side: the Philadelphia Fed’s Survey of Professional Forecasters and live prediction-market prices. They do not measure the same thing, and this page says exactly how they differ.
SPF survey 2026 Q3. Kalshi prices as of Oct 15, 2026, 7:51 AM ET. Updated daily; the SPF updates quarterly.
By Arthur Angelo, PredictionScout Research · Updated Oct 15, 2026, 7:51 AM ET
These numbers measure different things
- SPF: the average probability that about 30-40 professional forecasters assign to real GDP declining in a given quarter, asked once per quarter. It is a probability judgment, measured against the data as eventually reported.
- Kalshi GDP markets: the price of “real GDP growth above 0.0%” in BEA’s advance estimate for one quarter; we show one minus that price. That is the closest market match to the SPF question, but it settles on the first estimate only.
- Kalshi “recession” markets: two consecutive quarters of negative growth in advance estimates within a set window. That is a common rule of thumb, not the National Bureau of Economic Research’s official recession dating, and neither SPF number asks it.
Key findings
- Forecasters are more worried than traders. In the Philadelphia Fed’s 2026 Q3 survey, professional forecasters put the chance of real GDP falling in Q4 2026 at 20.0% (the “Anxious Index”). Kalshi traders put the chance of negative growth in that quarter at 6%, in a thin market (138 contracts traded).
- Quarter by quarter: Q3 2026: forecasters 13.3%, Kalshi 1%; Q4 2026: forecasters 20.0%, Kalshi 6%; Q1 2027: forecasters 21.5%, Kalshi 10%; Q2 2027: forecasters 21.9%, Kalshi 11%.
- Kalshi’s “recession” markets ask about two straight quarters of negative GDP growth in BEA’s advance estimates, not an official recession call. They price 4% for Recession this year? and 20% for Recession in 2027?.
- Timing matters. The survey was taken in the middle of Q3 2026; Kalshi prices are live and move with every data release. In the previous survey, forecasters gave Q4 2026 a 24.5% chance of a decline.
Chance of a shrinking quarter
| Quarter | Forecasters (SPF) | Previous survey | Kalshi | Kalshi bid/ask spread | Kalshi contracts |
|---|---|---|---|---|---|
| Q3 2026 | 13.3% | 25.1% | 0.5% | 1¢ | 6,745 |
| Q4 2026 | 20.0% | 24.5% | 6.0% | 10¢ | 138 |
| Q1 2027 | 21.5% | 25.7% | 10.0% | 10¢ | 326 |
| Q2 2027 | 21.9% | 23.0% | 11.0% | 8¢ | 655 |
| Q3 2027 | 20.8% | no market |
A wide bid/ask spread means few traders and a less reliable price.
Kalshi recession odds over time
The Anxious Index, recent surveys
| Survey | Chance GDP falls next quarter |
|---|---|
| 2026 Q3 | 20.0% |
| 2026 Q2 | 25.1% |
| 2026 Q1 | 20.9% |
| 2025 Q4 | 24.0% |
| 2025 Q3 | 29.6% |
| 2025 Q2 | 36.1% |
| 2025 Q1 | 15.4% |
| 2024 Q4 | 15.0% |
| 2024 Q3 | 21.0% |
| 2024 Q2 | 18.7% |
| 2024 Q1 | 23.9% |
| 2023 Q4 | 40.9% |
Source: Federal Reserve Bank of Philadelphia, Anxious Index. Full history since 1968 in the CSV.
Download the data
Quarter-by-quarter comparison (CSV)SPF decline probabilities, every survey (CSV)
Kalshi columns are implied chances from bid/ask midpoints, not raw price histories. Free to reuse under CC BY 4.0 with a link back to this page.
Embed this chart
Methodology
- Forecasters. Philadelphia Fed Survey of Professional Forecasters, variable RECESS (mean probability of a decline in real GDP) for the survey quarter and the four following quarters, from the published probability file. The Anxious Index is the next-quarter value.
- Markets. Kalshi public API: for each open quarterly GDP event, one minus the bid/ask midpoint of “Above 0.0%”; and the
KXRECSSNBERevents (two consecutive negative advance-estimate quarters). Month-end history from daily candles. - Not a forecast comparison yet. Neither number can be scored until BEA publishes the quarters. We will add results as they come in.
- Related: how accurate Kalshi’s GDP markets have been.
Cite this research
Suggested citation: PredictionScout. (2026, October 15). Recession Odds: Prediction Markets vs. Professional Forecasters. https://predictionscout.com/research/recession-odds-prediction-markets-vs-forecasters/
For a chart or news story: “Source: PredictionScout analysis of public exchange data (https://predictionscout.com/research/recession-odds-prediction-markets-vs-forecasters/)”
The data and charts on this page are free to reuse under CC BY 4.0 with a link back to this page. Survey data: Federal Reserve Bank of Philadelphia. Market data: Kalshi.
Data sources: prices and volumes come from the public APIs of Kalshi and Polymarket, with survey data from the Federal Reserve Bank of Philadelphia. All trademarks belong to their owners. PredictionScout is independent and not affiliated with any exchange. Nothing here is investment, betting, or legal advice.