Kalshi’s monthly tornado markets missed the count by a median 44 tornadoes (39%) at the start of each month.
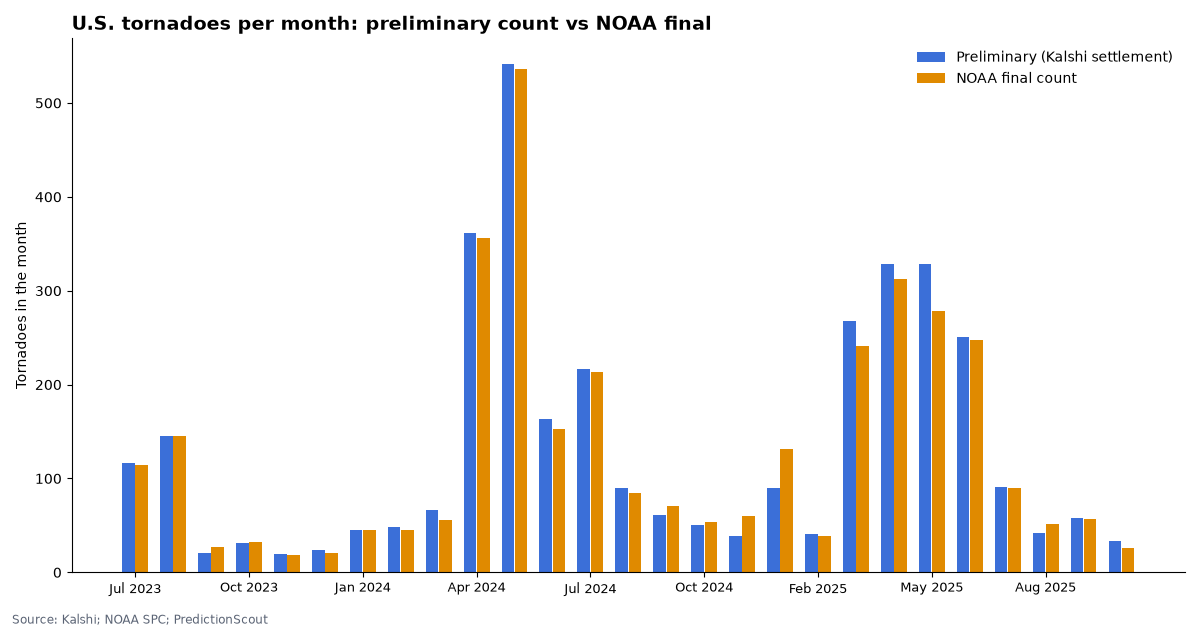
Kalshi settles monthly U.S. tornado markets on the National Weather Service’s preliminary count. NOAA’s final count, published months later after damage surveys, is often different: for the 27 months where both exist, the preliminary figures Kalshi settled on add up to 3,571 tornadoes and the final counts to 3,504. In 10 of those months, the final count would have settled at least one contract differently.
Kalshi market data and NOAA Storm Prediction Center data, pulled Oct 15, 2026, 7:59 AM ET. Updated daily.
By Arthur Angelo, PredictionScout Research · Updated Oct 15, 2026, 7:59 AM ET
Key findings
- Start-of-month forecast: median miss 44 tornadoes. Over 20 months, the market’s implied median on the first day of the month was off by a median 39% of the count. Threshold contracts went the way the market leaned 138 of 171 times (81%).
- Preliminary vs. final: 3,571 vs. 3,504. Preliminary counts come from storm reports filed within hours; NWS offices then survey damage and merge or drop reports. Final numbers appear in NOAA’s Storm Data and the SPC tornado database, currently complete through 2025. Largest gaps: May 2025: 329 preliminary, 278 final; Dec 2024: 90 preliminary, 131 final; Mar 2025: 268 preliminary, 241 final.
- 10 months would settle differently on final counts. Dec 2023 (settled 24, final 21); Feb 2024 (settled 48, final 45); Oct 2024 (settled 50, final 54); Nov 2024 (settled 39, final 60); Dec 2024 (settled 90, final 131). Kalshi settles on the preliminary number and markets are not reopened.
- Settlement check: 6 of 35 months match the sum of SPC’s daily filtered reports exactly. The daily report files are a close proxy for the preliminary monthly count, not the identical source. September 2026: Kalshi settled on 55; the daily filtered reports sum to 57.
Preliminary vs. final tornado counts
The National Weather Service publishes a preliminary tornado count from local storm reports within hours. Reports can double-count a single tornado seen by several people, or miss tornadoes found later in damage surveys. Months later, NOAA publishes the final count in Storm Data, which is what climate records use. Kalshi’s rules settle on the preliminary count, so a market can pay out on a number the official record later changes.
Month by month
| Month | Market median, 1st of month | Kalshi settled (preliminary) | SPC daily filtered reports | NOAA final count | Contracts called right | Contracts traded |
|---|---|---|---|---|---|---|
| Sep 2026 | 103 | 55 | 57 | not yet final | 2/3 | 17,133 |
| Aug 2026 | 107 | 98 | 100 | not yet final | 7/8 | 25,265 |
| Jul 2026 | 175 | 132 | 137 | not yet final | 2/2 | 97,155 |
| Jun 2026 | 192 | 383 | 399 | not yet final | 5/8 | 391,829 |
| May 2026 | outside range | 166 | 174 | not yet final | 6/11 | 689,587 |
| Apr 2026 | 230 | 292 | 306 | not yet final | 7/9 | 229,869 |
| Mar 2026 | outside range | 196 | 211 | not yet final | 6/6 | 165,723 |
| Feb 2026 | outside range | 52 | 55 | not yet final | 0/0 | 89,586 |
| Jan 2026 | outside range | 23 | not yet final | 8/8 | 61,055 | |
| Dec 2025 | outside range | 16 | 14 | 0/0 | 40,097 | |
| Nov 2025 | 54 | 14 | 12 | 3/5 | 55,536 | |
| Oct 2025 | 48 | 33 | 34 | 26 | 2/2 | 20,071 |
| Sep 2025 | outside range | 58 | 58 | 57 | 2/2 | 16,307 |
| Aug 2025 | 86 | 42 | 42 | 51 | 2/4 | 53,230 |
| Jul 2025 | 141 | 91 | 96 | 90 | 3/5 | 76,707 |
| Jun 2025 | 219 | 251 | 252 | 247 | 8/8 | 248,109 |
| May 2025 | 309 | 329 | 332 | 278 | 9/9 | 147,649 |
| Apr 2025 | 243 | 328 | 352 | 313 | 8/9 | 211,933 |
| Mar 2025 | 98 | 268 | 300 | 241 | 5/8 | 235,888 |
| Feb 2025 | 56 | 41 | 43 | 39 | 5/6 | 234,560 |
| Dec 2024 | 46 | 90 | 145 | 131 | 3/3 | 466,131 |
| Nov 2024 | 38 | 39 | 39 | 60 | 6/7 | 111,200 |
| Oct 2024 | outside range | 50 | 53 | 54 | 2/2 | 22,431 |
| Sep 2024 | 42 | 61 | 73 | 71 | 3/4 | 10,417 |
| Aug 2024 | outside range | 90 | 94 | 85 | 0/2 | 10,053 |
| Jul 2024 | outside range | 217 | 221 | 213 | 3/3 | 23,524 |
| Jun 2024 | 292 | 163 | 166 | 153 | 6/8 | 20,018 |
| May 2024 | 286 | 542 | 571 | 536 | 8/11 | 29,748 |
| Apr 2024 | outside range | 362 | 384 | 356 | 5/5 | 34,750 |
| Mar 2024 | 92 | 66 | 67 | 56 | 7/8 | 23,929 |
| Feb 2024 | 39 | 48 | 52 | 45 | 5/5 | 24,019 |
| Jan 2024 | outside range | 45 | 45 | 45 | 0/0 | 15,322 |
| Dec 2023 | outside range | 24 | 46 | 21 | 0/0 | 11,303 |
| Nov 2023 | outside range | 20 | 20 | 18 | 0/0 | 3,765 |
| Oct 2023 | outside range | 31 | 31 | 32 | 0/0 | 2,924 |
| Sep 2023 | outside range | 21 | 22 | 27 | 0/0 | 4,679 |
| Aug 2023 | outside range | 145 | 148 | 145 | 0/0 | 20,389 |
| Jul 2023 | outside range | 116 | 117 | 114 | 0/0 | 3,294 |
* Some daily report files were unavailable, so the sum is incomplete. Final counts: SPC tornado database (one row per tornado, full track).
Download the data
Tornado markets vs NOAA counts (CSV)
One row per settled market period. Per-contract price histories are not included. Free to reuse under CC BY 4.0 with a link back to this page.
Embed this chart
Methodology
- Markets. Kalshi’s monthly tornado series (
KXTORNADO, earlierTORNADO-events): “above X tornadoes” contracts, from Kalshi’s public API. Prices are hourly bid/ask midpoints (or last trade) at midnight ET on the first day of the month; the implied median is where the chance of “above X” crosses 50%. - Preliminary counts. Kalshi’s recorded settlement value, cross-checked by summing SPC’s daily filtered tornado report files for the month. SPC’s monthly preliminary page (Kalshi’s stated source) is generated in the browser and is not read directly.
- Final counts. The SPC Severe Weather Database “actual tornadoes” file, counting one row per tornado (full-track record).
- Limits. Final counts lag by many months, so recent months can only be compared with preliminary data; storm-report days run 12Z to 12Z, not calendar days. Nothing here is investment advice. Last run: Oct 15, 2026, 7:59 AM ET.
Cite this research
Suggested citation: PredictionScout. (2026, October 15). Tornado Prediction Markets vs. NOAA: Preliminary Counts, Final Counts and How Kalshi Settles. https://predictionscout.com/research/tornado-prediction-markets-vs-noaa/
For a chart or news story: “Source: PredictionScout analysis of public exchange data (https://predictionscout.com/research/tornado-prediction-markets-vs-noaa/)”
The data and charts on this page are free to reuse under CC BY 4.0 with a link back to this page. Market data: Kalshi. Tornado counts: NOAA/NWS Storm Prediction Center.
Data sources: prices and volumes come from the public APIs of Kalshi and Polymarket, with tornado data from the NOAA Storm Prediction Center. All trademarks belong to their owners. PredictionScout is independent and not affiliated with any exchange. Nothing here is investment, betting, or legal advice.
Related: earthquake markets · markets vs official numbers · hottest-year markets · All research