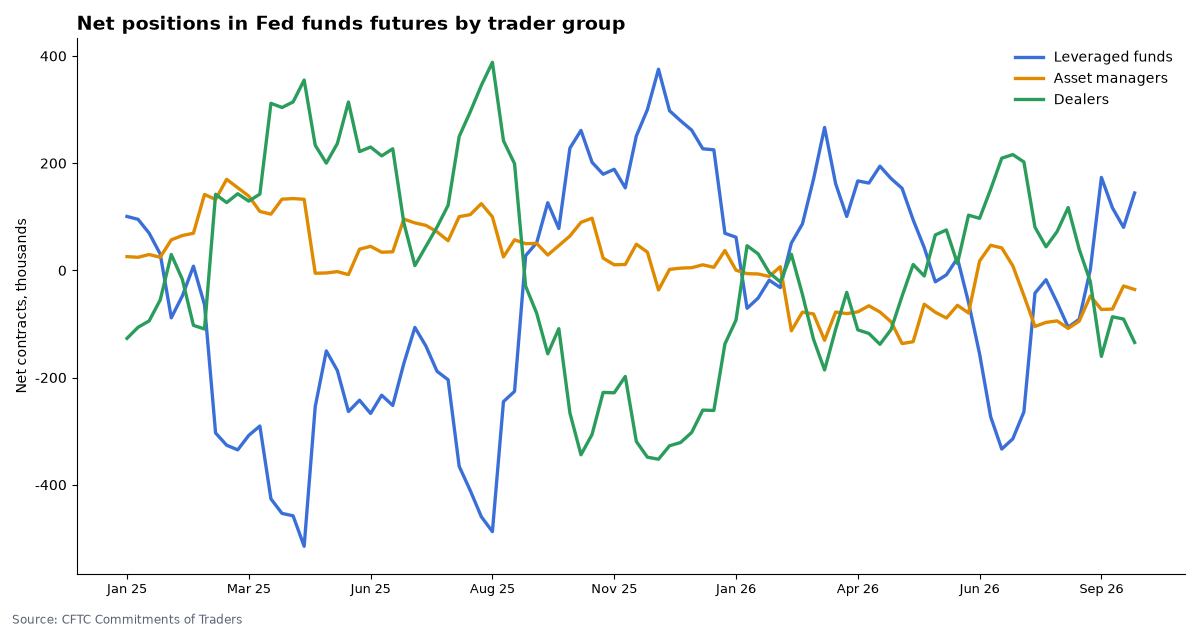
Leveraged funds are net +144,379 contracts in Fed funds futures, and Kalshi gives a hold at the Oct 28 meeting 72%.
Two public views of rate expectations side by side: the CFTC’s weekly Commitments of Traders report for Fed funds futures, and Kalshi’s market odds for each FOMC decision. Latest COT report: Oct 6, 2026.
Updated daily; the CFTC publishes new data on Fridays. Page checked Oct 15, 2026, 7:48 AM ET.
By Arthur Angelo, PredictionScout Research · Updated Oct 15, 2026, 7:48 AM ET
Key findings
- Positioning. In the CFTC report for Oct 6, 2026, open interest in 30-day Fed funds futures was 2,343,262 contracts (-234,785 from the week before). Leveraged funds held 508,608 long and 364,229 short, a net +144,379. Asset managers were net -35,632 and dealers net -134,517.
- Range since January 2025. Leveraged funds’ net position in this contract has ranged from -514,783 to +375,279; the latest reading ranks 69 of 92 weekly reports from lowest to highest.
- What Kalshi prices now. For the October 28 FOMC decision, Kalshi traders put 72.0% on a hold, 27.5% on a hike and 1.0% on a cut (Oct 15, 2026, 7:48 AM ET). Kalshi’s five outcome prices can add to slightly more than 100%.
- How closely the two move together. Across 77 weekly changes with both datasets, the correlation between the change in leveraged funds’ net position and the change in Kalshi’s cut probability was +0.03 (1.00 means they always move together, 0 means no link). Futures positions reflect hedging and spread trades as well as rate views, so this is not a measure of agreement on the rate path.
Who holds Fed funds futures
What Kalshi priced for the next meeting, week by week
Upcoming dates
- FOMC decision: Oct 28, 2026, Dec 9, 2026 (Federal Reserve calendar; statement at 2:00 PM ET).
- Next COT report: normally Friday at 3:30 PM ET, covering positions as of the prior Tuesday.
Weekly data, last 26 weeks
| COT date | Open interest | Leveraged funds net | Asset managers net | Dealers net | Next meeting | Kalshi cut | Kalshi hike |
|---|---|---|---|---|---|---|---|
| 2026-10-06 | 2,343,262 | +144,379 | -35,632 | -134,517 | 2026-10-28 | 1.0% | 17.7% |
| 2026-09-29 | 2,578,047 | +80,253 | -29,141 | -90,905 | 2026-10-28 | 1.0% | 46.8% |
| 2026-09-22 | 2,518,412 | +116,547 | -72,229 | -86,515 | 2026-10-28 | 1.0% | 51.7% |
| 2026-09-15 | 2,401,545 | +173,421 | -72,914 | -160,502 | 2026-09-16 | 1.0% | 88.6% |
| 2026-09-08 | 2,136,373 | +1,543 | -47,822 | -21,038 | 2026-09-16 | 1.0% | 54.7% |
| 2026-09-01 | 2,857,486 | -91,028 | -94,583 | +39,179 | 2026-09-16 | 1.0% | 61.1% |
| 2026-08-25 | 2,764,513 | -106,026 | -108,335 | +117,211 | 2026-09-16 | 1.0% | 32.8% |
| 2026-08-18 | 2,557,960 | -60,085 | -94,256 | +72,401 | 2026-09-16 | 1.0% | 28.9% |
| 2026-08-11 | 2,387,555 | -17,451 | -97,074 | +43,980 | 2026-09-16 | 2.0% | 41.4% |
| 2026-08-04 | 2,353,124 | -42,437 | -104,576 | +80,562 | 2026-09-16 | 2.0% | 50.2% |
| 2026-07-28 | 2,688,322 | -263,963 | -47,032 | +202,287 | 2026-07-29 | 1.0% | 24.6% |
| 2026-07-21 | 2,406,137 | -314,258 | +8,518 | +216,008 | 2026-07-29 | 1.0% | 17.7% |
| 2026-07-14 | 2,276,254 | -333,379 | +41,961 | +209,323 | 2026-07-29 | 1.0% | 7.0% |
| 2026-07-07 | 2,325,148 | -273,170 | +46,841 | +151,363 | 2026-07-29 | 2.0% | 15.8% |
| 2026-06-30 | 2,430,120 | -155,935 | +17,544 | +97,082 | 2026-07-29 | 1.9% | 20.5% |
| 2026-06-23 | 2,187,080 | -59,793 | -79,471 | +102,985 | 2026-07-29 | 2.0% | 24.0% |
| 2026-06-16 | 2,095,395 | +22,592 | -65,168 | +12,812 | 2026-06-17 | 1.0% | 1.0% |
| 2026-06-09 | 1,799,526 | -8,441 | -88,934 | +75,395 | 2026-06-17 | 2.0% | 1.0% |
| 2026-06-02 | 1,701,171 | -21,339 | -78,110 | +66,102 | 2026-06-17 | 3.0% | 1.0% |
| 2026-05-26 | 1,939,945 | +42,479 | -63,102 | -10,451 | 2026-06-17 | 3.0% | 2.0% |
| 2026-05-19 | 1,908,126 | +94,147 | -133,079 | +10,970 | 2026-06-17 | 3.4% | 2.0% |
| 2026-05-12 | 1,779,352 | +153,033 | -136,560 | -47,872 | 2026-06-17 | 3.0% | 2.0% |
| 2026-05-05 | 1,594,391 | +171,413 | -95,846 | -110,556 | 2026-06-17 | 4.9% | 2.0% |
| 2026-04-28 | 1,954,442 | +194,371 | -77,660 | -137,915 | 2026-04-29 | 1.0% | 1.0% |
| 2026-04-21 | 1,862,668 | +162,915 | -66,034 | -117,653 | 2026-04-29 | 1.0% | 1.0% |
| 2026-04-14 | 1,857,369 | +166,909 | -77,447 | -110,964 | 2026-04-29 | 2.0% | 1.0% |
Download the data
Weekly positioning and Kalshi odds (CSV)
One row per weekly COT report since January 2025. Free to reuse under CC BY 4.0 with a link back to this page.
Embed this chart
Methodology
- Positioning. CFTC “Traders in Financial Futures” report, market FED FUNDS – Chicago Board of Trade (30-day rates), via the CFTC public reporting API. Positions are as of Tuesday and published the following Friday. Net = long minus short; spread positions are not netted.
- Kalshi odds. The Kalshi FOMC decision markets (KXFEDDECISION). For each COT date we take the first meeting that had not yet happened at 4 PM ET and the hourly bid/ask midpoint of each outcome (last trade if the spread is wider than 10¢). Cut = all cut outcomes combined; hike = all hike outcomes combined. A week is skipped when the outcomes’ prices do not sum to between 85% and 120%.
- Correlation. Pearson correlation between the weekly change in leveraged funds’ net position and the weekly change in Kalshi’s cut probability, using only pairs of consecutive weeks that point to the same meeting.
- Limits. Futures positioning is not a forecast. Kalshi odds are for a single meeting; the futures contract covers a monthly average rate. See how Kalshi’s Fed odds have performed in our Fed decision accuracy study.
Cite this research
Suggested citation: PredictionScout. (2026, October 15). Fed Funds Futures Positioning vs. Kalshi Fed Odds. https://predictionscout.com/research/fed-funds-futures-positioning-vs-kalshi-odds/
For a chart or news story: “Source: PredictionScout analysis of public exchange data (https://predictionscout.com/research/fed-funds-futures-positioning-vs-kalshi-odds/)”
The data and charts on this page are free to reuse under CC BY 4.0 with a link back to this page.
Data sources: prices and volumes come from the public APIs of Kalshi and Polymarket, the CFTC Commitments of Traders report and the Federal Reserve. All trademarks belong to their owners. PredictionScout is independent and not affiliated with any exchange. Nothing here is investment, betting, or legal advice.