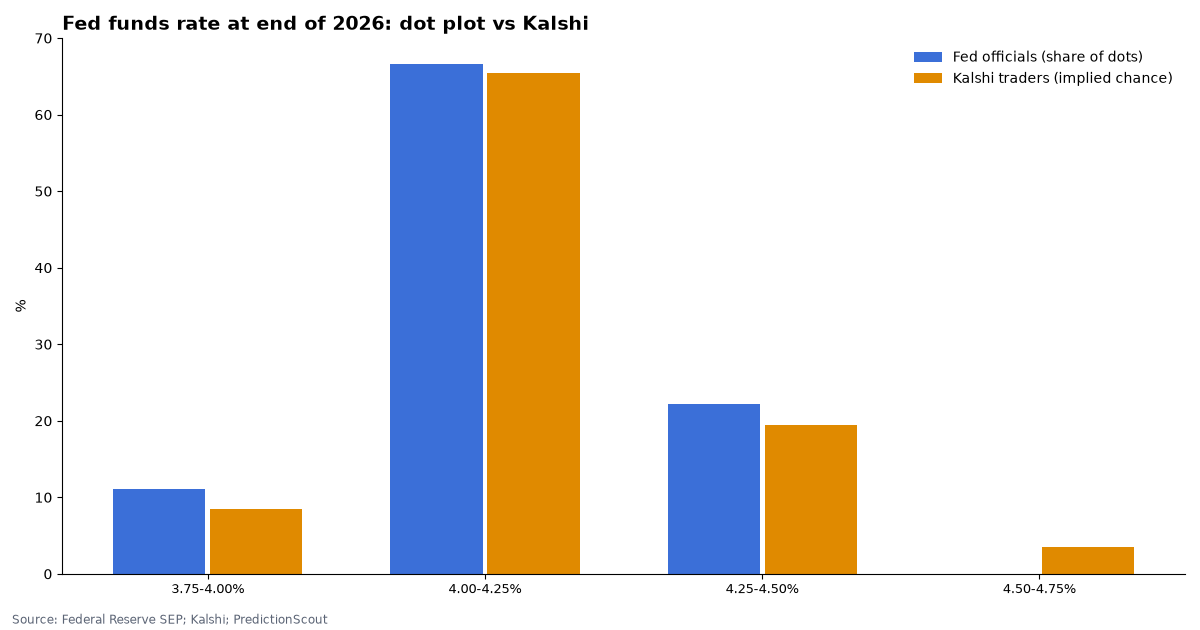
Fed officials’ median: 1 hike by the end of 2026. Kalshi traders: 66% chance of exactly that.
The Federal Reserve’s dot plot shows where each official expects the federal funds rate at year-end. Prediction markets price the same question. Here they are side by side, using the Sep 16, 2026 projections and live Kalshi odds.
Fed projections: Sep 16, 2026. Kalshi prices as of Oct 15, 2026, 7:51 AM ET. Target range from FRED as of Oct 14, 2026. Updated daily.
By Arthur Angelo, PredictionScout Research · Updated Oct 15, 2026, 7:51 AM ET
Key findings
- Officials and traders agree on the most likely end point. The median of the 18 dots in the Sep 16, 2026 projections puts the rate’s midpoint at 4.125% at the end of 2026 (1 hike from today’s 3.75–4.00% range). Kalshi’s median for the rate after the December meeting is 4.125%.
- Side by side. no change: 2 of 18 officials vs. 8% on Kalshi; 1 hike: 12 of 18 officials vs. 66% on Kalshi; 2 hikes: 4 of 18 officials vs. 20% on Kalshi; 3 hikes: 0 of 18 officials vs. 3% on Kalshi.
- Averages. The average dot is 4.15%; the probability-weighted Kalshi outcome is 4.16%.
- Since the previous projections (06/17/2026), the median end-2026 dot moved from 3.750% to 4.125%.
- Next meeting (Fed funds rate after Oct 2026 meeting?): no change 72%; 1 hike 26% on Kalshi.
End of 2026: dots vs. odds
| Target range at year-end | vs. today | Fed officials (dots) | Kalshi implied chance |
|---|---|---|---|
| 3.75–4.00% | no change | 2 of 18 (11%) | 8% |
| 4.00–4.25% | 1 hike | 12 of 18 (67%) | 66% |
| 4.25–4.50% | 2 hikes | 4 of 18 (22%) | 20% |
| 4.50–4.75% | 3 hikes | 0 of 18 (0%) | 3% |
The full dot plot
| Midpoint | 2026 | 2027 | 2028 | 2029 | Longer run |
|---|---|---|---|---|---|
| 4.375% | 4 | 8 | |||
| 4.125% | 12 | 6 | 4 | ||
| 3.875% | 2 | 5 | 3 | 2 | |
| 3.750% | 1 | ||||
| 3.625% | 3 | 3 | 7 | 2 | |
| 3.500% | 2 | ||||
| 3.375% | 1 | 2 | 1 | ||
| 3.250% | 2 | ||||
| 3.125% | 1 | 4 | 4 | 1 | |
| 3.000% | 6 | ||||
| 2.875% | 1 | 1 |
Number of FOMC participants at each midpoint, Sep 16, 2026. Source: Federal Reserve, Summary of Economic Projections, Figure 2.
Why they can differ
They answer different questions. A dot is one official’s view of the appropriate policy path under their own outlook; it is not a forecast of what the committee will do, and the Fed does not say which dot belongs to whom. Not every participant votes. Kalshi prices are traders’ odds of the actual decision, and they move every day while the dots are updated only four times a year. Kalshi lists ranges by their upper bound; we convert to midpoints to match the dot plot.
Download the data
End-2026 dots vs Kalshi (CSV)Full dot plot (latest two SEPs) (CSV)
Kalshi columns are implied chances derived from bid/ask midpoints, not raw prices. Free to reuse under CC BY 4.0 with a link back to this page.
Embed this chart
Methodology
- Fed projections. Figure 2 of the latest FOMC Summary of Economic Projections: the number of participants at each projected midpoint of the target range (rounded to 1/8 point) for the end of each year. The median dot is the middle value of all dots.
- Market odds. Kalshi’s
KXFEDevent for the rate after the last meeting of the year: each “above X%” contract refers to the upper bound of the target range. We take the bid/ask midpoint, force prices to fall as the threshold rises, and difference neighboring contracts to get the chance of each range. The widest bid/ask spread among contracts between 3¢ and 97¢ is 6¢. Later-year Kalshi events trade too thinly for a reliable comparison, so we compare the current year only. - Current range. FRED series DFEDTARL and DFEDTARU.
- See also: how accurate prediction markets are on Fed decisions and fed funds futures positioning vs Kalshi.
Cite this research
Suggested citation: PredictionScout. (2026, October 15). The Fed's Dot Plot vs. Prediction Markets: Where Officials and Traders See Rates. https://predictionscout.com/research/fed-dot-plot-vs-prediction-markets/
For a chart or news story: “Source: PredictionScout analysis of public exchange data (https://predictionscout.com/research/fed-dot-plot-vs-prediction-markets/)”
The data and charts on this page are free to reuse under CC BY 4.0 with a link back to this page. Projections: Federal Reserve Board. Market data: Kalshi.
Data sources: prices and volumes come from the public APIs of Kalshi and Polymarket, with projections from the Federal Reserve Board. All trademarks belong to their owners. PredictionScout is independent and not affiliated with any exchange. Nothing here is investment, betting, or legal advice.