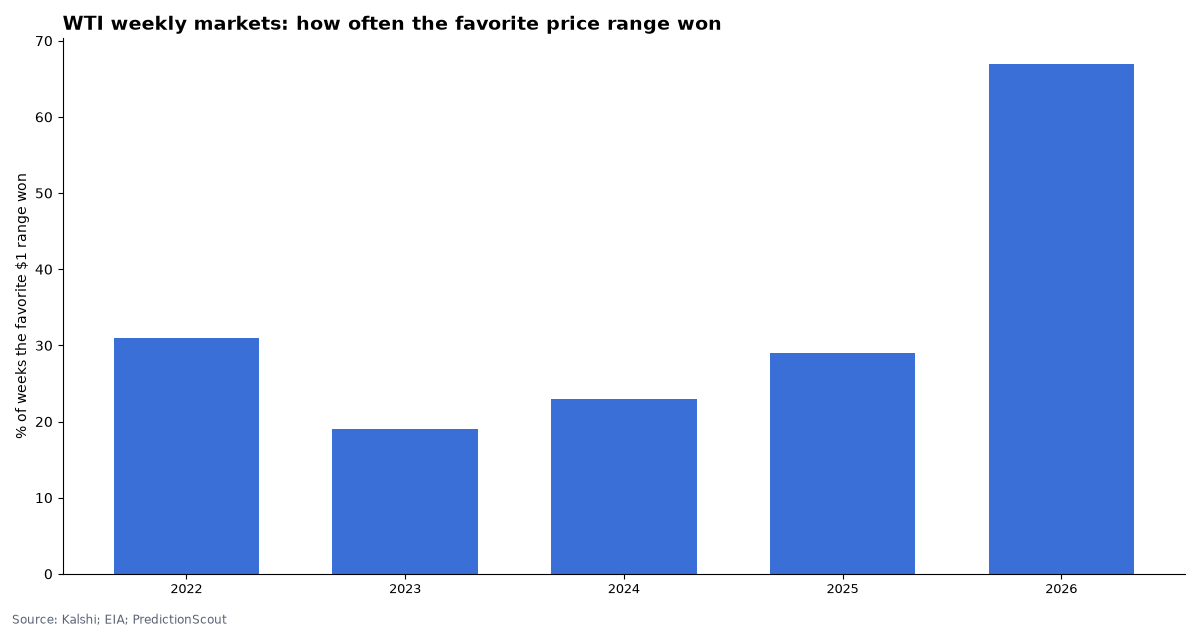
Kalshi’s favorite price range for WTI crude won 45 of 120 weeks, and the winning range carried an average 24% chance.
Every Friday Kalshi settles a ladder of $1-wide brackets on the price of West Texas Intermediate crude, using the ICE front-month futures price. We compare each settlement with the EIA’s official Cushing spot price for the same day: the typical gap is $0.44, and 70 of 120 settlements fall in the same $1 bracket as the EIA price.
Kalshi market data and EIA statistics, pulled Oct 15, 2026, 7:57 AM ET. Updated daily (WTI settles weekly, inventories weekly).
By Arthur Angelo, PredictionScout Research · Updated Oct 15, 2026, 7:57 AM ET
Key findings
- Favorite bracket right 38% of the time. The top-priced $1 range the day before won 45 of 120 weeks, and it averaged 33% implied probability, so the market itself said the favorite was usually wrong. The range that did win averaged 24%.
- Kalshi’s settlement and the EIA spot price differ by a median $0.44. They are different measurements: Kalshi uses the ICE futures price at its settlement time, while EIA reports the day’s Cushing spot price. In 50 of 120 weeks the two fall in different $1 brackets, so a trader reading the EIA number would have picked a different winning range. Gaps were wider in 2026, when oil prices were more volatile. ICE’s own settlement prices are licensed data, so we could not check Kalshi’s figures against them directly. The largest gap: Sep 25, 2026, Kalshi $92.41 vs. EIA $85.23.
- Inventories: only 2 scored weeks so far. Kalshi’s weekly crude-stocks markets began in September 2026; Sep 30, 2026: market median 427.2M barrels, EIA 427.3M; Oct 7, 2026: market median 428.8M barrels, EIA 424.1M. Some Kalshi settlements differ from the EIA figure; see the table. Threshold contracts went the way the market leaned 12 of 16 times (75%).
Weekly WTI price: Kalshi vs. the EIA spot price
Kalshi’s weekly WTI markets are brackets $1 wide. “Favorite” is the bracket priced highest a day before trading closed; its probability is normalized so the brackets sum to 100%. Kalshi settles on the ICE front-month futures price; the EIA column is the Cushing, OK WTI spot price for the same Friday (or Thursday if Friday was a holiday). Weeks EIA has not yet published are left out.
| Week ending | Kalshi settled | EIA spot price | Same $1 bracket? | Favorite bracket | Favorite’s chance | Favorite won? | Winning bracket’s chance |
|---|---|---|---|---|---|---|---|
| Oct 2, 2026 | $91.11 | $97.89 | no | $93.00 to $93.99 | 14% | ✗ | 10% |
| Sep 25, 2026 | $92.41 | $85.23 | no | $95.00 to $95.99 | 13% | ✗ | 7% |
| Sep 18, 2026 | $96.08 | $101.44 | no | $97.00 to $97.99 | 15% | ✗ | 14% |
| Sep 11, 2026 | $100.05 | $101.27 | no | Above $103.99 | 25% | ✗ | 10% |
| Sep 4, 2026 | $91.48 | $92.69 | no | $91.00 to $91.99 | 18% | ✓ | 18% |
| Aug 28, 2026 | $83.40 | $84.57 | no | $83.00 to $83.99 | 21% | ✓ | 21% |
| Aug 21, 2026 | $87.06 | $87.21 | ✓ | $86.00 to $86.99 | 18% | ✗ | 15% |
| Aug 14, 2026 | $82.40 | $83.99 | no | $82.00 to $82.99 | 17% | ✓ | 17% |
| Aug 7, 2026 | $78.18 | $79.77 | no | $76.00 to $76.99 | 16% | ✗ | 13% |
| Jul 31, 2026 | $84.67 | $86.16 | no | $84.00 to $84.99 | 12% | ✓ | 12% |
| Jul 24, 2026 | $89.31 | $91.74 | no | Above $94.99 | 34% | ✗ | 5% |
| Jul 17, 2026 | $81.78 | $83.43 | ✓ | Above $77.99 | 56% | ✓ | 56% |
| Jul 10, 2026 | $71.41 | $72.45 | no | $71.00 to $71.99 | 20% | ✓ | 20% |
| Jul 2, 2026 | $68.69 | $69.73 | no | $68.00 to $68.99 | 25% | ✓ | 25% |
| Jun 26, 2026 | $69.23 | $70.30 | ✓ | Below $71.00 | 39% | ✓ | 39% |
| Jun 18, 2026 | $75.85 | $80.35 | no | Below $79.00 | 85% | ✓ | 85% |
| Jun 12, 2026 | $84.88 | $88.62 | no | Below $85.00 | 21% | ✓ | 21% |
| Jun 5, 2026 | $90.54 | $94.32 | no | Above $93.99 | 35% | ✗ | 9% |
| May 29, 2026 | $87.36 | $91.16 | no | Below $91.00 | 69% | ✓ | 69% |
| May 22, 2026 | $96.60 | $100.35 | no | Below $95.00 | 38% | ✗ | 7% |
| May 15, 2026 | $105.42 | $108.99 | ✓ | $102 or above | 43% | ✓ | 43% |
| May 8, 2026 | $95.42 | $98.87 | no | $95.99 or below | 50% | ✓ | 50% |
| May 1, 2026 | $101.94 | $105.38 | ✓ | $101 or above | 73% | ✓ | 73% |
| Apr 24, 2026 | $94.40 | $98.42 | ✓ | $91 or above | 81% | ✓ | 81% |
| Apr 10, 2026 | $96.57 | $98.34 | ✓ | $105.99 or below | 88% | ✓ | 88% |
| Apr 3, 2026 | $111.54 | $113.23 | ✓ | $107 or above | 85% | ✓ | 85% |
| Mar 27, 2026 | $99.64 | $101.26 | no | $91.99 or below | 18% | ✗ | 3% |
| Mar 20, 2026 | $98.23 | $98.71 | ✓ | $98 to 98.99 | 12% | ✓ | 12% |
| Mar 13, 2026 | $98.71 | $98.48 | ✓ | $98 or above | 31% | ✓ | 31% |
| Mar 6, 2026 | $90.90 | $90.77 | ✓ | $74.0 or above | 88% | ✓ | 88% |
| Feb 27, 2026 | $67.02 | $66.96 | no | $66.00 to 66.99 | 22% | ✗ | 11% |
| Feb 20, 2026 | $66.48 | $66.69 | ✓ | $66.00 to 66.99 | 27% | ✓ | 27% |
| Feb 13, 2026 | $62.89 | $63.05 | no | $62 to 62.99 | 28% | ✓ | 28% |
| Feb 6, 2026 | $63.55 | $63.77 | ✓ | $63 to 63.99 | 31% | ✓ | 31% |
| Jan 30, 2026 | $65.21 | $64.50 | ✓ | $64.0 or above | 71% | ✓ | 71% |
| Jan 23, 2026 | $61.07 | $60.70 | no | $59 to 59.99 | 34% | ✗ | 6% |
| Jan 16, 2026 | $59.44 | $59.40 | ✓ | $59 to 59.99 | 26% | ✓ | 26% |
| Jan 9, 2026 | $59.12 | $58.96 | no | $57 to 57.99 | 37% | ✗ | 5% |
| Jan 2, 2026 | $57.32 | $57.21 | ✓ | $57 to 57.99 | 47% | ✓ | 47% |
| Dec 26, 2025 | $56.74 | $56.60 | ✓ | $58 to 58.99 | 40% | ✗ | 6% |
Last 40 weeks. The CSV has every scored week.
Weekly crude oil inventories
Kalshi’s KXEIACRUDEW ladders settle on the EIA’s weekly U.S. commercial crude oil stocks, in millions of barrels. The market median is taken 24 hours before the report.
| Report date | Market median | Kalshi settled | EIA stocks | Miss |
|---|---|---|---|---|
| Oct 7, 2026 | 428.8M | 424.1M | 427.3M | -4.7M |
| Sep 30, 2026 | 427.2M | 427.3M | 426.4M | +0.1M |
Download the data
WTI weekly vs EIA spot (CSV)Crude inventories vs EIA (CSV)
One row per settled market period. Per-contract price histories are not included. Free to reuse under CC BY 4.0 with a link back to this page.
Embed this chart
Methodology
- Markets. Kalshi’s
KXWTIWweekly WTI brackets ($1 ranges) andKXEIACRUDEWcrude-inventory ladders, from Kalshi’s public API. Bracket prices are hourly bid/ask midpoints 24 hours before close, normalized to sum to 1. Weeks where the winning bracket had no price, or where more than one bracket settled YES, are skipped. - Official data. EIA WTI Cushing spot price (FRED series DCOILWTICO) for the Friday the market closes, and EIA weekly U.S. commercial crude stocks excluding the SPR (series WCESTUS1, Weekly Petroleum Status Report), in millions of barrels.
- Limits. The favorite in a $1-wide ladder is expected to lose most weeks; the useful comparison is whether the winning range carried more probability than a random bracket. EIA spot prices are daily closes and can differ slightly from the price Kalshi’s rules use. Nothing here is investment advice. Last run: Oct 15, 2026, 7:57 AM ET.
Cite this research
Suggested citation: PredictionScout. (2026, October 15). How Accurate Are Prediction Markets on Oil Prices? Kalshi WTI Markets vs. EIA. https://predictionscout.com/research/oil-prediction-markets-vs-eia/
For a chart or news story: “Source: PredictionScout analysis of public exchange data (https://predictionscout.com/research/oil-prediction-markets-vs-eia/)”
The data and charts on this page are free to reuse under CC BY 4.0 with a link back to this page. Market data: Kalshi. Oil prices and stocks: U.S. Energy Information Administration.
Data sources: prices and volumes come from the public APIs of Kalshi and Polymarket, with oil data from the Energy Information Administration. All trademarks belong to their owners. PredictionScout is independent and not affiliated with any exchange. Nothing here is investment, betting, or legal advice.
Related: 10-year Treasury markets · markets vs official numbers · accuracy scorecard · All research