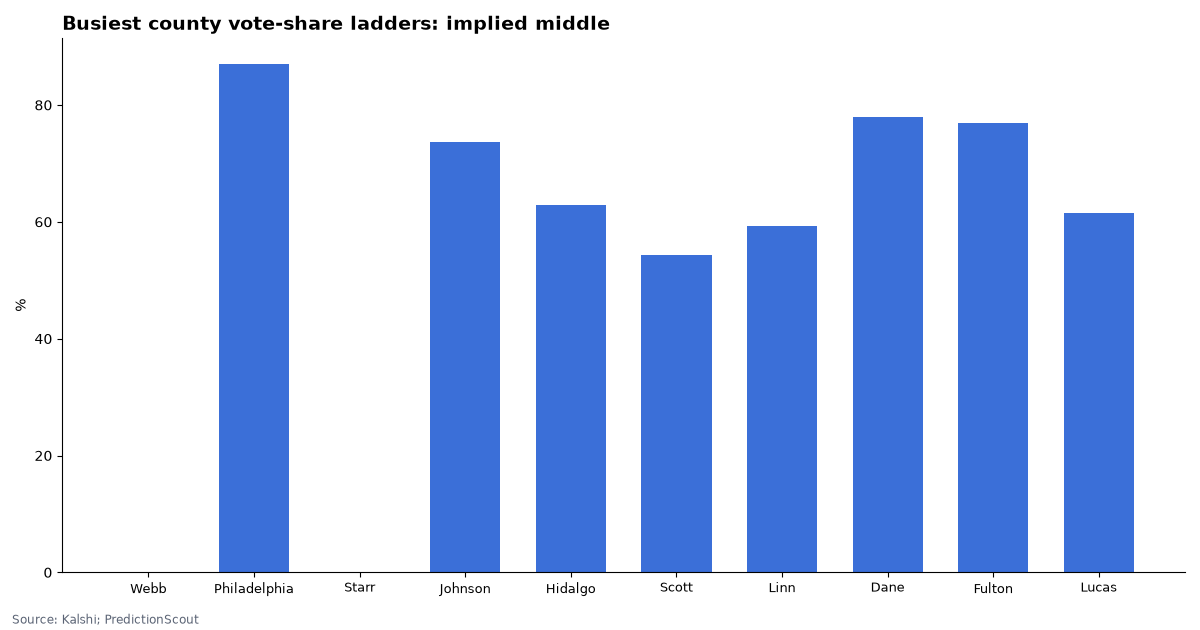
Kalshi lists 49 county vote-share ladders and 37 county-winner markets for the 2026 Senate and governor races, from Harris County, Texas to Miami-Dade.
Each settles on the county’s certified count, not the statewide winner, so a candidate can lose the state and still pay off a county market. This page shows today’s odds and, where we hold the state’s official county file, the last result.
Kalshi market data and Florida Division of Elections results, pulled Oct 23, 2026, 8:37 AM ET. Updated daily.
By Arthur Angelo, PredictionScout Research · Updated Oct 23, 2026, 8:37 AM ET
Key findings
- 49 county vote-share ladders, 37 county-winner markets. All settle on certified county counts.
- Busiest: James Talarico in Webb County, Texas: 56%+: 96%, 58%+: 96%, 60%+: 96%, 62%+: 94%.
- Close counties. 10 county-winner markets sit between 35% and 65%, including Orange (California gubernatorial) 42%; San Bernardino (California gubernatorial) 38%; Miami-Dade (Florida Senate) 40%; Lyon (Kansas Senate) 62%.
- Miami-Dade. In 2024 the Senate winner took 54.4% there under Florida’s official count.
How county markets work
County vote share. Each rung asks whether a named candidate gets at least X% of the certified vote in one county, counting both endpoints. The share is of all votes cast for that office in the county, including minor candidates and write-ins where the county counts them.
County winner. Each market asks whether a named candidate gets the most votes in one county. Georgia’s Senate markets settle on the first round.
Settlement. The county figure in the state’s certified results (the canvass). Counties certify first, then the state; Kalshi uses the official count, not election-night tallies, so payouts come weeks after November 3.
What moves the price. Statewide polls, county early-vote and mail-ballot returns, registration shifts, and on election night the order in which counties report: big urban counties often count mail ballots late, so early partial shares can mislead.
Worked example: Miami-Dade, 2024 Senate
Florida’s official county file shows Rick Scott (Republican) with 585,445 votes and Debbie Mucarsel-Powell (Democrat) with 477,598, out of 1,076,114 Senate votes in Miami-Dade. That is 54.4% and 44.4%. A “wins Miami-Dade” market would have paid the first candidate; for the second, an “at least 45%” rung would have paid No and “at least 44%” Yes.
County vote-share ladders, today
Midpoints of rungs with a live two-sided quote, forced to fall as the threshold rises; “middle” is where the ladder crosses 50%. The last result is shown only where we use the state’s own certified county file (Florida); for other states see the state canvass.
| County | Candidate | At least… | Middle | Last official county result | Volume |
|---|---|---|---|---|---|
| Webb, Texas | James Talarico (Senate) | 56%+: 96%, 58%+: 96%, 60%+: 96%, 62%+: 94% | — | — | 11,818 |
| Philadelphia, Pennsylvania | Josh Shapiro (Governor) | 80%+: 97%, 82%+: 96%, 84%+: 95%, 90%+: 7%, 92%+: 5%, 94%+: 5%, 96%+: 5% | 87.1% | — | 9,845 |
| Starr, Texas | James Talarico (Senate) | 50%+: 96%, 52%+: 96%, 54%+: 94% | — | — | 9,757 |
| Johnson, Iowa | Josh Turek (Senate) | 68%+: 95%, 70%+: 89%, 78%+: 5%, 80%+: 3%, 82%+: 3% | 73.7% | — | 9,230 |
| Hidalgo, Texas | James Talarico (Senate) | 52%+: 96%, 54%+: 96%, 56%+: 96%, 58%+: 93%, 68%+: 5% | 62.9% | — | 8,005 |
| Scott, Iowa | Josh Turek (Senate) | 48%+: 94%, 50%+: 86%, 60%+: 5%, 62%+: 3% | 54.4% | — | 6,863 |
| Linn, Iowa | Josh Turek (Senate) | 52%+: 96%, 54%+: 94%, 60%+: 44%, 62%+: 26%, 66%+: 5% | 59.3% | — | 5,902 |
| Dane, Wisconsin | David Crowley (Governor) | 72%+: 96%, 74%+: 94%, 82%+: 6%, 84%+: 4%, 86%+: 3%, 88%+: 3%, 90%+: 3% | 78.0% | — | 4,892 |
| Fulton, Georgia | Jon Ossoff (Senate) | 72%+: 96%, 82%+: 5%, 84%+: 3%, 86%+: 3% | 77.0% | — | 4,853 |
| Lucas, Ohio | Sherrod Brown (Senate) | 56%+: 96%, 64%+: 31%, 68%+: 5%, 70%+: 3%, 72%+: 3% | 61.6% | — | 4,225 |
| Maricopa, Arizona | Katie Hobbs (Governor) | 48%+: 94%, 60%+: 6%, 62%+: 5%, 64%+: 3%, 66%+: 3% | 54.0% | — | 4,187 |
| Gwinnett, Georgia | Jon Ossoff (Senate) | 58%+: 95%, 68%+: 10%, 70%+: 6%, 72%+: 5% | 63.3% | — | 4,149 |
| Palm Beach, Florida | David Jolly (Governor) | 48%+: 96%, 60%+: 6%, 62%+: 5%, 64%+: 3%, 66%+: 3% | 54.1% | 2022: DeSantis (Republican) 51.2%, margin 2.9 pts | 3,907 |
| Genesee, Michigan | Abdul El-Sayed (Senate) | 58%+: 6%, 60%+: 3%, 62%+: 3%, 64%+: 3% | — | — | 3,881 |
| Hamilton, Ohio | Sherrod Brown (Senate) | 58%+: 94%, 68%+: 6%, 70%+: 3%, 72%+: 3% | 63.1% | — | 3,872 |
| Wake, North Carolina | Roy Cooper (Senate) | 62%+: 97%, 64%+: 94%, 74%+: 5%, 76%+: 3% | 68.9% | — | 3,853 |
| Milwaukee, Wisconsin | David Crowley (Governor) | 66%+: 94%, 76%+: 5%, 78%+: 3%, 80%+: 3%, 82%+: 3%, 84%+: 3% | 70.9% | — | 3,792 |
| Franklin, Ohio | Sherrod Brown (Senate) | 64%+: 96%, 74%+: 5%, 76%+: 3%, 78%+: 3%, 80%+: 3% | 69.0% | — | 3,501 |
| New York, New York | Kathy Hochul (Governor) | 78%+: 93%, 88%+: 5%, 90%+: 3%, 92%+: 3%, 94%+: 3% | 82.9% | — | 3,391 |
| Los Angeles, California | Xavier Becerra (Governor) | 62%+: 94%, 66%+: 78%, 76%+: 5%, 78%+: 3% | 69.9% | — | 3,311 |
| Oakland, Michigan | Abdul El-Sayed (Senate) | 50%+: 96%, 52%+: 90%, 56%+: 48%, 62%+: 5%, 64%+: 3% | 55.8% | — | 3,212 |
| Polk, Iowa | Josh Turek (Senate) | 66%+: 6%, 68%+: 3%, 70%+: 3% | — | — | 3,150 |
| Travis, Texas | James Talarico (Senate) | 72%+: 96%, 80%+: 6%, 82%+: 3%, 84%+: 3%, 86%+: 3% | 76.0% | — | 3,094 |
| Broward, Florida | David Jolly (Governor) | 54%+: 96%, 56%+: 96%, 68%+: 6%, 70%+: 3%, 72%+: 3% | 62.1% | 2022: Crist (Democrat) 57.3%, margin 15.4 pts | 2,939 |
| Cook, Illinois | JB Pritzker (Governor) | 70%+: 96%, 80%+: 6%, 82%+: 3%, 84%+: 3%, 86%+: 3%, 88%+: 3%, 90%+: 3% | 75.1% | — | 2,753 |
| Washtenaw, Michigan | Abdul El-Sayed (Senate) | 68%+: 93%, 72%+: 61%, 78%+: 3%, 80%+: 3%, 82%+: 3% | 73.1% | — | 2,693 |
| Queens, New York | Kathy Hochul (Governor) | 56%+: 96%, 58%+: 95%, 70%+: 5%, 72%+: 3%, 74%+: 3%, 76%+: 3% | 64.0% | — | 2,664 |
| Macomb, Michigan | Mike Rogers (Senate) | 48%+: 96%, 58%+: 6%, 60%+: 5%, 62%+: 3% | 53.1% | — | 2,662 |
| Mecklenburg, North Carolina | Roy Cooper (Senate) | 66%+: 96%, 76%+: 5%, 78%+: 3%, 80%+: 3% | 71.1% | — | 2,628 |
| Tarrant, Texas | James Talarico (Senate) | 48%+: 95%, 58%+: 6%, 60%+: 3%, 62%+: 3%, 64%+: 3% | 53.1% | — | 2,572 |
| Dallas, Texas | James Talarico (Senate) | 64%+: 96%, 74%+: 5%, 76%+: 3%, 78%+: 3% | 69.0% | — | 2,434 |
| Clark, Nevada | Aaron Ford (Governor) | 46%+: 96%, 48%+: 96%, 60%+: 6%, 62%+: 5%, 64%+: 3% | 54.2% | — | 2,422 |
| Harris, Texas | James Talarico (Senate) | 54%+: 96%, 56%+: 95%, 66%+: 5%, 68%+: 3% | 61.0% | — | 2,407 |
| Pima, Arizona | Katie Hobbs (Governor) | 58%+: 96%, 70%+: 5%, 72%+: 3%, 74%+: 3%, 76%+: 3% | 64.0% | — | 2,355 |
| Waukesha, Wisconsin | Tom Tiffany (Governor) | 50%+: 96%, 52%+: 93%, 54%+: 84%, 62%+: 6%, 64%+: 5%, 66%+: 3%, 68%+: 3% | 57.5% | — | 2,215 |
| Cobb, Georgia | Jon Ossoff (Senate) | 58%+: 94%, 70%+: 5% | 63.9% | — | 2,005 |
| Bexar, Texas | James Talarico (Senate) | 56%+: 96%, 58%+: 95%, 68%+: 5%, 70%+: 3% | 63.0% | — | 1,854 |
| Montgomery, Pennsylvania | Josh Shapiro (Governor) | 64%+: 96%, 66%+: 96%, 68%+: 96%, 70%+: 95%, 74%+: 56%, 78%+: 5%, 80%+: 3% | 74.5% | — | 1,766 |
| Kent, Michigan | Abdul El-Sayed (Senate) | 48%+: 92%, 50%+: 83%, 58%+: 6%, 60%+: 5%, 62%+: 3% | 53.5% | — | 1,741 |
| Miami-Dade, Florida | Byron Donalds (Governor) | 56%+: 5%, 58%+: 5%, 60%+: 3%, 62%+: 3%, 64%+: 3% | — | 2022: DeSantis (Republican) 55.3%, margin 11.3 pts | 1,611 |
| Allegheny, Pennsylvania | Josh Shapiro (Governor) | 64%+: 96%, 66%+: 96%, 68%+: 96%, 76%+: 6%, 78%+: 3%, 80%+: 3% | 72.1% | — | 1,594 |
| Washington, Ohio | Jon Husted (Senate) | 56%+: 96%, 58%+: 96%, 70%+: 5% | 64.0% | — | 1,515 |
| Hillsborough, Florida | David Jolly (Governor) | 58%+: 6%, 60%+: 5%, 62%+: 3%, 64%+: 3%, 66%+: 3% | — | 2022: DeSantis (Republican) 54.2%, margin 9.2 pts | 1,223 |
| Cuyahoga, Ohio | Sherrod Brown (Senate) | 66%+: 95%, 76%+: 5%, 78%+: 3%, 80%+: 3%, 82%+: 3% | 71.0% | — | 1,039 |
| Collin, Texas | James Talarico (Senate) | 46%+: 95%, 56%+: 7%, 58%+: 5%, 60%+: 3% | 51.1% | — | 749 |
| Kings, New York | Kathy Hochul (Governor) | 66%+: 95%, 78%+: 7%, 80%+: 5%, 82%+: 3% | 72.1% | — | 433 |
| Wayne, Michigan | Abdul El-Sayed (Senate) | 70%+: 5%, 72%+: 3%, 74%+: 3%, 76%+: 3% | — | — | 430 |
| Orange, California | Xavier Becerra (Governor) | 58%+: 6%, 60%+: 5%, 62%+: 3%, 64%+: 3% | — | — | 245 |
| Montgomery, Ohio | Sherrod Brown (Senate) | 50%+: 96%, 62%+: 6%, 64%+: 3%, 66%+: 3% | 56.1% | — | 2 |
Who wins the county, today
| Race | Candidate | County | Chance | Last official county result | Volume |
|---|---|---|---|---|---|
| Arizona gubernatorial | Katie Hobbs | Maricopa | 89% | — | 1,286 |
| Arizona gubernatorial | Katie Hobbs | Navajo | 34% | — | 5,451 |
| Arizona gubernatorial | Katie Hobbs | Yuma | 21% | — | 4,784 |
| Arizona gubernatorial | Katie Hobbs | Pinal | 14% | — | 401 |
| Arizona gubernatorial | Katie Hobbs | Cochise | 11% | — | 548 |
| California gubernatorial | Steve Hilton | Fresno | 74% | — | 4,876 |
| California gubernatorial | Steve Hilton | Orange | 42% | — | 5,647 |
| California gubernatorial | Steve Hilton | San Bernardino | 38% | — | 4,796 |
| Florida Senate | Angie Nixon | Broward | 94% | 2024: Debbie Mucarsel-Powell (Democrat) 59.4%, margin 20.1 pts | 1,530 |
| Florida Senate | Angie Nixon | Miami-Dade | 40% | 2024: Rick Scott (Republican) 54.4%, margin 10.0 pts | 10,559 |
| Florida gubernatorial | Byron Donalds | Sarasota | 91% | 2022: DeSantis (Republican) 60.9%, margin 22.3 pts | 0 |
| Georgia Senate | Jon Ossoff | Peach | 75% | — | 221 |
| Georgia Senate | Jon Ossoff | Burke | 68% | — | 112 |
| Georgia Senate | Jon Ossoff | Spalding | 26% | — | 1,000 |
| Kansas Senate | Adam Hamilton | Johnson | 98% | — | 15 |
| Kansas Senate | Adam Hamilton | Shawnee | 96% | — | 0 |
| Kansas Senate | Adam Hamilton | Riley | 96% | — | 0 |
| Kansas Senate | Adam Hamilton | Lyon | 62% | — | 967 |
| Kansas Senate | Adam Hamilton | Sedgwick | 52% | — | 2,485 |
| Kansas Senate | Adam Hamilton | Geary | 47% | — | 3,527 |
| Kansas Senate | Adam Hamilton | Harvey | 25% | — | 1 |
| Kansas Senate | Adam Hamilton | Leavenworth | 17% | — | 1,682 |
| Kansas Senate | Adam Hamilton | Crawford | 11% | — | 10 |
| Michigan Senate | Abdul El-Sayed | Oakland | 95% | — | 3,208 |
| Michigan Senate | Abdul El-Sayed | Kent | 90% | — | 7,194 |
| Michigan Senate | Abdul El-Sayed | Genesee | 83% | — | 1,844 |
| Michigan Senate | Abdul El-Sayed | Grand Traverse | 62% | — | 3,704 |
| Nevada Governor | Aaron Ford | Clark | 98% | — | 5,124 |
| Nevada Governor | Aaron Ford | Washoe | 88% | — | 6,196 |
| Nevada Governor | Aaron Ford | Douglas | 3% | — | 0 |
| Texas Senate | James Talarico | Fort Bend | 94% | — | 3,268 |
| Texas Senate | James Talarico | Tarrant | 86% | — | 8,202 |
| Texas Senate | James Talarico | Collin | 68% | — | 8,856 |
| Texas Senate | James Talarico | Denton | 41% | — | 9,931 |
| Texas Senate | James Talarico | Bastrop | 40% | — | 3,104 |
| Texas Senate | James Talarico | Bell | 35% | — | 2,575 |
| Texas Senate | James Talarico | Brazoria | 31% | — | 1,926 |
Scoring after certification
We save every ladder daily and a final snapshot on the evening of November 3, then score each county against its certified count.
Download the data
County vote-share ladders today (CSV)County-winner markets today (CSV)Florida official county results (2022 governor, 2024 Senate) (CSV)
Today’s county ladders and winner markets, plus Florida’s official county results. No price histories are included. Free to reuse under CC BY 4.0 with a link back to this page.
Embed this chart
Methodology
- Markets. Every open Kalshi
KXVOTECOUNTYandKXGENERALCOUNTYcontract, read from the public API with full paging. - Prices. Bid/ask midpoint, only where a two-sided quote is no wider than 10¢. Ladders are forced to fall as the threshold rises.
- Official results. Florida Division of Elections official results extracts for November 8, 2022 and November 5, 2024. Shares are of all votes for the office in the county.
- Scoring. Daily snapshots; scoring once counties certify.
- Limits. Nothing has settled yet. Turnout and candidates change; prior results are context, not a forecast. Official baselines are shown only for Florida. Nothing here is investment advice. Last run: Oct 23, 2026, 8:37 AM ET.
Cite this research
Suggested citation: PredictionScout. (2026, October 23). County Election Prediction Markets for 2026. https://predictionscout.com/research/county-election-prediction-markets/
For a chart or news story: “Source: PredictionScout analysis of public exchange data (https://predictionscout.com/research/county-election-prediction-markets/)”
The data and charts on this page are free to reuse under CC BY 4.0 with a link back to this page. Market data: Kalshi. Official results: Florida Division of Elections.
Data sources: prices and volumes come from the public APIs of Kalshi and Polymarket, with official county results from the Florida Division of Elections. All trademarks belong to their owners. PredictionScout is independent and not affiliated with any exchange. Nothing here is investment, betting, or legal advice.
Related: vote-share and margin markets · House vote and seat markets · All research