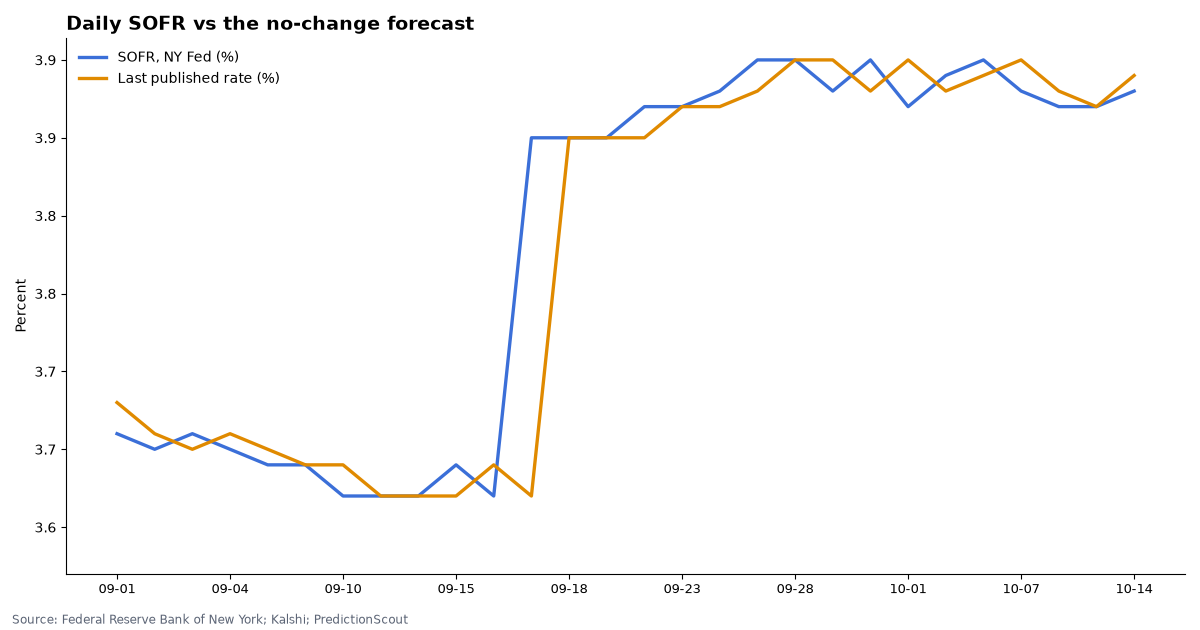
Kalshi’s favorite SOFR bracket was right on 9 of 28 days.
Simply assuming SOFR would match the last published rate was right on 10. We priced every settled Kalshi daily SOFR market about three hours after it opened (late morning or midday ET on the rate date, after the previous day’s SOFR was published) and compared it with the rate the New York Fed published. On the 20 days SOFR changed from the previous day, the market favorite was right 5 times and the no-change guess 2.
Kalshi market data and New York Fed reference rates, pulled Oct 16, 2026, 12:12 PM ET. Updated daily.
By Arthur Angelo, PredictionScout Research · Updated Oct 16, 2026, 12:12 PM ET
Key findings
- Market favorite: 9 of 28 days (32%). The no-change forecast: 10 of 28 (36%).
- When SOFR moved. SOFR differed from the prior day’s rate on 20 of 28 days; the market’s favorite caught 5 of those moves.
- Thin trading. 19 of 47 settled days had no quote or trade in the 48 hours before our pricing time and are left out.
- Settlements check out. 28 of 28 daily settlements match the SOFR the New York Fed published.
- Latest SOFR: 3.89% for Oct 15, 2026, on $3,025 billion of transactions (New York Fed).
- Quarter-end fed funds. Kalshi’s 3 settled EFFR markets all match the New York Fed’s published effective federal funds rate (Mar 31, 2026: 3.64%; Jun 30, 2026: 3.63%; Sep 30, 2026: 3.88%).
Every scored day
| Rate date | SOFR (NY Fed) | Change | Kalshi favorite, ~3h after open | Favorite right? | Last published rate (no-change guess) | Kalshi settled bracket | Contracts traded |
|---|---|---|---|---|---|---|---|
| Oct 14, 2026 | 3.88% | -0.01 | Exactly 3.86% (4.5¢) | ✗ | 3.89% ✗ | Exactly 3.88% | 3,953 |
| Oct 9, 2026 | 3.87% | +0.00 | 3.91% or Above (5.5¢) | ✗ | 3.87% ✓ | Exactly 3.87% | 6,866 |
| Oct 8, 2026 | 3.87% | -0.01 | Exactly 3.90% (4¢) | ✗ | 3.88% ✗ | Exactly 3.87% | 9,884 |
| Oct 7, 2026 | 3.88% | -0.02 | Exactly 3.87% (4.5¢) | ✗ | 3.90% ✗ | Exactly 3.88% | 5,283 |
| Oct 6, 2026 | 3.90% | +0.01 | 3.85% or Below (6¢) | ✗ | 3.89% ✗ | Exactly 3.90% | 6,614 |
| Oct 5, 2026 | 3.89% | +0.01 | Exactly 3.90% (90¢) | ✗ | 3.88% ✗ | Exactly 3.89% | 11,683 |
| Oct 1, 2026 | 3.87% | -0.03 | 3.91% or Above (5.5¢) | ✗ | 3.90% ✗ | Exactly 3.87% | 6,858 |
| Sep 30, 2026 | 3.90% | +0.02 | 3.91% or Above (63¢) | ✗ | 3.88% ✗ | Exactly 3.90% | 15,032 |
| Sep 29, 2026 | 3.88% | -0.02 | 3.85% or Below (5¢) | ✗ | 3.90% ✗ | Exactly 3.88% | 8,714 |
| Sep 28, 2026 | 3.90% | +0.00 | Exactly 3.88% (99¢) | ✗ | 3.90% ✓ | 3.89% or Above | 9,670 |
| Sep 25, 2026 | 3.90% | +0.02 | 3.88% or Above (94¢) | ✓ | 3.88% ✓ | 3.88% or Above | 21,423 |
| Sep 24, 2026 | 3.88% | +0.01 | Exactly 3.87% (75¢) | ✗ | 3.87% ✗ | 3.88% or Above | 7,979 |
| Sep 23, 2026 | 3.87% | +0.00 | Exactly 3.87% (96¢) | ✓ | 3.87% ✓ | Exactly 3.87% | 10,857 |
| Sep 22, 2026 | 3.87% | +0.02 | Exactly 3.84% (5.5¢) | ✗ | 3.85% ✗ | Exactly 3.87% | 8,752 |
| Sep 21, 2026 | 3.85% | +0.00 | Exactly 3.86% (45¢) | ✗ | 3.85% ✓ | Exactly 3.85% | 9,481 |
| Sep 18, 2026 | 3.85% | +0.00 | Exactly 3.85% (55¢) | ✓ | 3.85% ✓ | Exactly 3.85% | 7,026 |
| Sep 17, 2026 | 3.85% | +0.23 | 3.66% or Above (99.5¢) | ✓ | 3.62% ✗ | 3.66% or Above | 29,092 |
| Sep 16, 2026 | 3.62% | -0.02 | Exactly 3.62% (54¢) | ✓ | 3.64% ✗ | Exactly 3.62% | 5,135 |
| Sep 15, 2026 | 3.64% | +0.02 | 3.66% or Above (48¢) | ✗ | 3.62% ✗ | Exactly 3.64% | 19,307 |
| Sep 14, 2026 | 3.62% | +0.00 | Exactly 3.62% (31.5¢) | ✓ | 3.62% ✓ | Exactly 3.62% | 4,958 |
| Sep 11, 2026 | 3.62% | +0.00 | Exactly 3.62% (33¢) | ✓ | 3.62% ✓ | Exactly 3.62% | 4,600 |
| Sep 10, 2026 | 3.62% | -0.02 | Exactly 3.64% (31¢) | ✗ | 3.64% ✗ | Exactly 3.62% | 2,554 |
| Sep 9, 2026 | 3.64% | +0.00 | 3.60% or Below (3.5¢) | ✗ | 3.64% ✓ | Exactly 3.64% | 4,434 |
| Sep 8, 2026 | 3.64% | -0.01 | Exactly 3.64% (27.5¢) | ✓ | 3.65% ✗ | Exactly 3.64% | 7,195 |
| Sep 4, 2026 | 3.65% | -0.01 | Exactly 3.63% (6.5¢) | ✗ | 3.66% ✗ | Exactly 3.65% | 16,474 |
| Sep 3, 2026 | 3.66% | +0.01 | 3.66% or Above (10¢) | ✓ | 3.65% ✗ | 3.66% or Above | 3,591 |
| Sep 2, 2026 | 3.65% | -0.01 | Exactly 3.61% (1.5¢) | ✗ | 3.66% ✗ | Exactly 3.65% | 3,475 |
| Sep 1, 2026 | 3.66% | -0.02 | 3.60% or Below (5.5¢) | ✗ | 3.68% ✓ | 3.66% or Above | 4,631 |
Kalshi lists each day’s SOFR as brackets of one basis point (0.01 percentage point) plus open-ended tails, and closes the market at 7:59 AM ET on the morning the New York Fed publishes the rate. Prices are hourly-candle midpoints (last trade when the spread is wider than 10¢).
Quarter-end effective fed funds rate
| Rate date | Kalshi settlement | NY Fed EFFR | Match | Contracts traded |
|---|---|---|---|---|
| Mar 31, 2026 | 3.64 | 3.64% | ✓ | 34,748 |
| Jun 30, 2026 | 3.63% | 3.63% | ✓ | 7,802 |
| Sep 30, 2026 | 3.88 | 3.88% | ✓ | 20,495 |
Download the data
Daily SOFR markets (CSV)Quarter-end EFFR markets (CSV)
One row per settled market period. Per-contract price histories are not included. Free to reuse under CC BY 4.0 with a link back to this page.
Embed this chart
Methodology
- Markets. Kalshi’s daily SOFR series
KXSOFRDand quarter-end effective fed funds seriesKXEFFR, from Kalshi’s public API. Each SOFR event is priced about three hours after it opened (late morning or midday ET on the rate date, after the previous day’s SOFR was published); the favorite is the highest-priced bracket. - Official rates. The Secured Overnight Financing Rate and effective federal funds rate from the New York Fed’s public markets API, matched by rate date (Kalshi’s rules name the rate date for each event).
- No-change forecast. The most recent SOFR published before the rate date. It is a hard benchmark because SOFR often repeats from day to day.
- Limits. About two months of daily markets; many brackets trade thinly; the New York Fed occasionally revises a published rate, and Kalshi settles on the first publication. Nothing here is investment advice. Last run: Oct 16, 2026, 12:12 PM ET.
Cite this research
Suggested citation: PredictionScout. (2026, October 16). SOFR and Fed Funds Prediction Markets vs. the New York Fed. https://predictionscout.com/research/sofr-fed-funds-prediction-markets-vs-new-york-fed/
For a chart or news story: “Source: PredictionScout analysis of public exchange data (https://predictionscout.com/research/sofr-fed-funds-prediction-markets-vs-new-york-fed/)”
The data and charts on this page are free to reuse under CC BY 4.0 with a link back to this page. Market data: Kalshi. Rates: Federal Reserve Bank of New York.
Data sources: prices and volumes come from the public APIs of Kalshi and Polymarket, with reference rates from the Federal Reserve Bank of New York. All trademarks belong to their owners. PredictionScout is independent and not affiliated with any exchange. Nothing here is investment, betting, or legal advice.
Related: Fed decision track record · fed funds futures positioning · 10-year Treasury markets · All research