Kalshi’s snowfall markets settled in line with the National Weather Service in 24 of 24 city-months last winter.
Kalshi lists monthly “more than X inches of snow” markets for 10 cities beyond New York. We checked every settled month from last winter against the official station total, priced each one at the start of the month, and set this season’s December 2026 odds against 30 years of station records. One change to note: this season’s markets settle on The Weather Company’s data, not the Weather Service reports used last winter.
Kalshi market data and NWS station records, pulled Oct 23, 2026, 10:45 AM ET. Updated daily.
By Arthur Angelo, PredictionScout Research · Updated Oct 23, 2026, 10:45 AM ET
Key findings
- 24 of 24 settled city-months match the NWS station total (Boston, Chicago, Detroit, Philadelphia, Seattle, Washington, D.C.; December 2025 to March 2026).
- At the start of each month, the side priced above 50¢ won 60 of 73 threshold contracts (82%); the market’s implied median missed the final total by a typical 3.3 inches across 9 months.
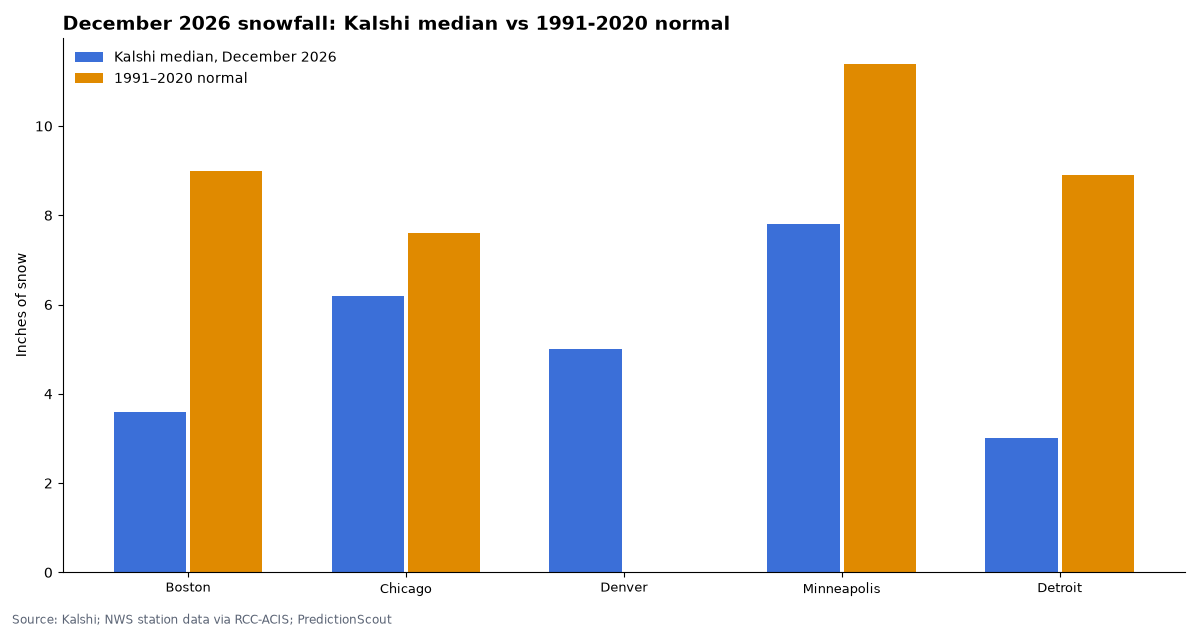
- December 2026 odds: in 4 of the 4 cities where the market median falls inside the listed thresholds, traders expect less snow than the 1991–2020 normal. Biggest gaps: Detroit 3.0 in vs an 8.9-inch normal; Boston 3.6 in vs a 9.0-inch normal; Minneapolis 7.8 in vs an 11.4-inch normal. Trading is thin: 129,121 contracts across all 10 cities so far.
- New settlement source. 10 of 10 open city markets now settle on The Weather Company’s snowfall dashboard; last winter’s markets named the NWS Daily Climate Report (CLI) for each airport. We keep checking against the NWS station record, so any gap between the two sources will show up here.
- Chicago had two December 2025 markets: one named Midway’s climate report and a second (“B”) event named O’Hare’s. Both are listed below.
- 26 ski resorts have opening-date markets for 2026/27; they settle on each resort’s announced first day of public skiing (ski opening dates).
December 2026 snowfall odds, city by city
Live prices from Kalshi (bid/ask midpoint, or the last trade when the spread is wide), as of the update time above. The market median is the snowfall total where the implied chance crosses 50%. In brackets: how often December snowfall at the same station topped that line in 1991–2020, from the NWS station record.
| City | Station | Market median, December 2026 | 1991–2020 normal | Same month last year | Market odds (share of Decembers 1991–2020 above the line) | Settles on |
|---|---|---|---|---|---|---|
| Boston | Logan Airport | 3.6 in | 9.0 in | 4.3 in | >2 in: 75% (1991–2020: 73%); >4 in: 43% (1991–2020: 70%); >6 in: 43% (1991–2020: 53%); >8 in: 23% (1991–2020: 47%); >10 in: 22% (1991–2020: 40%); >12 in: 29% (1991–2020: 23%) | Weather Company |
| Chicago | O’Hare | 6.2 in | 7.6 in | 9.5 in | >2 in: 82% (1991–2020: 63%); >4 in: 64% (1991–2020: 57%); >6 in: 52% (1991–2020: 43%); >8 in: 23% (1991–2020: 30%); >10 in: 54% (1991–2020: 27%); >12 in: 1% (1991–2020: 23%) | Weather Company |
| Denver | Denver International | 5.0 in | 6.6 in | >2 in: 97% (1991–2020: 81%); >4 in: 78% (1991–2020: 62%); >6 in: 23% (1991–2020: 56%); >8 in: 39% (1991–2020: 50%); >10 in: 4% (1991–2020: 44%); >12 in: 9% (1991–2020: 19%) | Weather Company | |
| Washington, D.C. | Reagan National | below 2 in | 1.7 in | 1.5 in | >2 in: 24% (1991–2020: 23%); >4 in: 24% (1991–2020: 13%); >6 in: 17% (1991–2020: 10%); >8 in: 7% (1991–2020: 3%); >10 in: 2% (1991–2020: 3%); >12 in: 6% (1991–2020: 3%) | Weather Company |
| Philadelphia | Philadelphia International | below 2 in | 3.5 in | 4.5 in | >2 in: 31% (1991–2020: 33%); >4 in: 29% (1991–2020: 33%); >6 in: 7% (1991–2020: 30%); >8 in: 8% (1991–2020: 20%); >10 in: 6% (1991–2020: 13%); >12 in: 4% (1991–2020: 7%) | Weather Company |
| Seattle | Sea-Tac | below 2 in | 1.7 in | 0.0 in | >2 in: 12% (1991–2020: 17%); >4 in: 1% (1991–2020: 9%); >6 in: 6% (1991–2020: 9%); >8 in: 6% (1991–2020: 4%); >10 in: 4% (1991–2020: 4%); >12 in: 1% (1991–2020: 4%) | Weather Company |
| Minneapolis | MSP Airport | 7.8 in | 11.4 in | 16.0 in | >4 in: 91% (1991–2020: 87%); >8 in: 48% (1991–2020: 53%); >12 in: 6% (1991–2020: 43%); >16 in: 17% (1991–2020: 27%); >20 in: 8% (1991–2020: 13%); >24 in: 2% (1991–2020: 7%) | Weather Company |
| Detroit | Detroit Metro | 3.0 in | 8.9 in | 10.9 in | >2 in: 87% (1991–2020: 83%); >4 in: 11% (1991–2020: 73%); >6 in: 7% (1991–2020: 53%); >8 in: 6% (1991–2020: 47%); >10 in: 1% (1991–2020: 33%); >12 in: 17% (1991–2020: 30%) | Weather Company |
| Pittsburgh | Pittsburgh International | below 2 in | 7.7 in | 18.4 in | >2 in: 22% (1991–2020: 77%); >4 in: 63% (1991–2020: 70%); >6 in: 2% (1991–2020: 53%); >8 in: 55% (1991–2020: 50%); >10 in: 22% (1991–2020: 43%); >12 in: 17% (1991–2020: 33%) | Weather Company |
| Milwaukee | Mitchell Airport | below 4 in | 10.4 in | 8.8 in | >4 in: 20% (1991–2020: 67%); >8 in: 13% (1991–2020: 50%); >12 in: 82% (1991–2020: 23%); >16 in: 85% (1991–2020: 17%); >20 in: 90% (1991–2020: 10%); >24 in: 84% (1991–2020: 10%) | Weather Company |
Last winter: every settled month vs the NWS record
Kalshi’s settlement value, or the range implied by which contracts paid out, against the monthly total at the station its rules named. A trace of snow counts as zero. The market median is taken from prices at 1 AM ET on the first day of the month.
| City | Month | Station | Kalshi settled on | NWS station total | Match | Market median, start of month | Contracts traded |
|---|---|---|---|---|---|---|---|
| Washington, D.C. | March 2026 | DCA | 1.0 in | 1.0 in | ✓ | 0.7 in | 116,136 |
| Seattle | March 2026 | SEA | 3.0 in | 3.0 in | ✓ | below 0.1 in | 66,226 |
| Philadelphia | March 2026 | PHL | range <–0.1 in | 0.0 in | ✓ | 1.8 in | 59,777 |
| Detroit | March 2026 | DTW | 0.6 in | 0.6 in | ✓ | 4.9 in | 76,099 |
| Chicago | March 2026 | ORD | 1.8 in | 1.8 in | ✓ | 3.2 in | 98,414 |
| Boston | March 2026 | BOS | 1.9 in | 1.9 in | ✓ | 3.1 in | 116,839 |
| Washington, D.C. | February 2026 | DCA | 1.1 in | 1.1 in | ✓ | 4.4 in | 447,206 |
| Seattle | February 2026 | SEA | range <–0.1 in | 0.0 in | ✓ | below 0.1 in | 97,961 |
| Philadelphia | February 2026 | PHL | 14.4 in | 14.4 in | ✓ | 7.7 in | 421,948 |
| Detroit | February 2026 | DTW | 4.9 in | 4.9 in | ✓ | 10.9 in | 124,502 |
| Chicago | February 2026 | ORD | 1.1 in | 1.1 in | ✓ | 8.9 in | 126,376 |
| Boston | February 2026 | BOS | 26.8 in | 26.8 in | ✓ | above 15 in | 129,084 |
| Washington, D.C. | January 2026 | DCA | 7.0 in | 7.0 in | ✓ | — | 965,332 |
| Seattle | January 2026 | SEA | range <–0.1 in | 0.0 in | ✓ | — | 92,177 |
| Philadelphia | January 2026 | PHL | 11.2 in | 11.2 in | ✓ | — | 474,469 |
| Detroit | January 2026 | DTW | 17.1 in | 17.1 in | ✓ | — | 72,907 |
| Chicago | January 2026 | ORD | 11.3 in | 11.3 in | ✓ | — | 245,734 |
| Boston | January 2026 | BOS | 29.8 in | 29.8 in | ✓ | — | 132,441 |
| Washington, D.C. | December 2025 | DCA | range 0.1–3 in | 1.5 in | ✓ | — | 130,728 |
| Seattle | December 2025 | SEA | range <–0.1 in | 0.0 in | ✓ | above 6 in | 143,934 |
| Philadelphia | December 2025 | PHL | range 3–6 in | 4.5 in | ✓ | — | 221,607 |
| Detroit | December 2025 | DTW | 10.9 in | 10.9 in | ✓ | — | 242,628 |
| Chicago | December 2025 | MDW | range <–25 in | missing | n/a | — | 0 |
| Chicago | December 2025 | ORD | 9.5 in | 9.5 in | ✓ | — | 602,118 |
| Boston | December 2025 | BOS | 4.3 in | 4.3 in | ✓ | — | 175,696 |
Ski resort opening-date markets
Kalshi lists one market per resort asking when it will open for the 2026/27 season. Each contract is a date: “Before Nov 20, 2026” pays $1 if the resort opens to the public before that day. The contracts stack, so the chances should rise as the dates get later. We show the first date the market gives at least a 50% chance as the market’s middle.
How it settles. On the resort’s own announcement of its first day of public lift-served skiing, backed up by major news outlets. Season-pass holder previews and uphill-only days generally do not count; each market’s rules spell out the details.
What moves it. Early storms and, just as much, cold nights. Most large resorts open on man-made snow, so a run of nights below about 28°F for snowmaking can matter more than natural snowfall. Resorts that traditionally open on a fixed weekend (such as Thanksgiving) move less.
Worked example. If “Before Nov 20” trades at 45¢ and “Before Nov 27” at 80¢, the market sees roughly a 35% chance of an opening in the week of Nov 20 to Nov 26, and the middle is “before Nov 27”. If the resort announces an opening on Nov 22, the first contract pays $0 and the second pays $1.
For context we add the current snow depth at the nearest NRCS SNOTEL station (USDA Natural Resources Conservation Service automated sites, usually at high elevation). Snow depth at one station is a rough guide, not what the market settles on. Vermont has no SNOTEL sites, so eastern resorts show none.
| Resort | State | Market middle | Opening-date ladder (chance) | Nearest SNOTEL snow depth | Contracts traded |
|---|---|---|---|---|---|
| Alta | UT | before Nov 29, 2026 | Before Nov 22, 2026: 4% · Before Nov 29, 2026: 99% · Before Dec 6, 2026: 99% · Before Dec 13, 2026: 91% · Before Dec 20, 2026: 95% | Atwater (0 km, 8,750 ft): 2 in on 2026-10-22 | 3,965 |
| Alyeska | AK | before Nov 15, 2026 | Before Nov 15, 2026: 85% · Before Nov 22, 2026: 26% · Before Nov 29, 2026: 70% · Before Dec 6, 2026: 86% · Before Dec 13, 2026: 96% | Mt. Alyeska (1 km, 1,500 ft): 5 in on 2026-10-22 | 5,138 |
| Aspen Mountain | CO | before Nov 29, 2026 | Before Nov 15, 2026: 8% · Before Nov 22, 2026: 20% · Before Nov 29, 2026: 92% · Before Dec 6, 2026: 98% · Before Dec 13, 2026: 98% | Chapman Tunnel (18 km, 10,090 ft): 0 in on 2026-10-22 | 70,101 |
| Bald Mountain (Sun Valley) | ID | before Nov 22, 2026 | Before Nov 22, 2026: 50% · Before Nov 29, 2026: 40% · Before Dec 6, 2026: 90% · Before Dec 13, 2026: 93% · Before Dec 20, 2026: 92% | Chocolate Gulch (12 km, 6,310 ft): 0 in on 2026-10-22 | 5,952 |
| Beaver Creek | CO | before Nov 29, 2026 | Before Nov 22, 2026: 15% · Before Nov 29, 2026: 88% · Before Dec 6, 2026: 95% · Before Dec 13, 2026: 95% · Before Dec 20, 2026: 96% | Beaver Ck Village (1 km, 8,530 ft): 1 in on 2026-10-22 | 2,490 |
| Big Bear Mountain | CA | before Nov 29, 2026 | Before Nov 15, 2026: 6% · Before Nov 22, 2026: 30% · Before Nov 29, 2026: 64% · Before Dec 6, 2026: 86% · Before Dec 13, 2026: 94% | No SNOTEL station within 40 km | 5,418 |
| Big Sky | MT | before Nov 29, 2026 | Before Nov 15, 2026: 2% · Before Nov 22, 2026: 6% · Before Nov 29, 2026: 96% · Before Dec 6, 2026: 98% · Before Dec 13, 2026: 98% | Lone Mountain (2 km, 8,820 ft): 0 in on 2026-10-22 | 134,446 |
| Breckenridge | CO | before Nov 8, 2026 | Before Nov 1, 2026: 1% · Before Nov 8, 2026: 79% · Before Nov 15, 2026: 92% · Before Nov 22, 2026: 98% · Before Nov 29, 2026: 98% | Copper Mountain (9 km, 10,500 ft): 0 in on 2026-10-22 | 13,613 |
| Copper Mountain | CO | before Nov 8, 2026 | Before Oct 25, 2026: 0% · Before Nov 1, 2026: 5% · Before Nov 8, 2026: 98% · Before Nov 15, 2026: 43% · Before Nov 22, 2026: 92% | Copper Mountain (2 km, 10,500 ft): 0 in on 2026-10-22 | 5,058 |
| Deer Valley | UT | before Dec 6, 2026 | Before Nov 22, 2026: 6% · Before Nov 29, 2026: 12% · Before Dec 6, 2026: 88% · Before Dec 13, 2026: 96% · Before Dec 20, 2026: 96% | Thaynes Canyon (5 km, 9,260 ft): 0 in on 2026-10-22 | 587 |
| Heavenly | CA | before Nov 22, 2026 | Before Nov 22, 2026: 87% · Before Nov 29, 2026: 70% · Before Dec 6, 2026: 93% · Before Dec 13, 2026: 95% · Before Dec 20, 2026: 94% | Heavenly Valley (3 km, 8,540 ft): 0 in on 2026-10-22 | 3,920 |
| Jackson Hole | WY | thin trading | Before Nov 22, 2026: 8% · Before Nov 29, 2026: 99% · Before Dec 6, 2026: 93% · Before Dec 13, 2026: 93% · Before Dec 20, 2026: 92% | Phillips Bench (11 km, 8,170 ft): 0 in on 2026-10-22 | 381 |
| Keystone | CO | before Nov 1, 2026 | Before Oct 25, 2026: 15% · Before Nov 1, 2026: 58% · Before Nov 8, 2026: 96% · Before Nov 15, 2026: 96% · Before Nov 22, 2026: 98% | Grizzly Peak (9 km, 11,110 ft): 0 in on 2026-10-22 | 6,708 |
| Killington | VT | before Nov 8, 2026 | Before Nov 1, 2026: 17% · Before Nov 8, 2026: 78% · Before Nov 15, 2026: 87% · Before Nov 22, 2026: 85% · Before Nov 29, 2026: 99% | No SNOTEL station within 40 km | 2,197 |
| Mammoth Mountain | CA | thin trading | Before Nov 8, 2026: 12% · Before Nov 15, 2026: 84% · Before Nov 22, 2026: 91% · Before Nov 29, 2026: 94% · Before Dec 6, 2026: 96% | No SNOTEL station within 40 km | 212 |
| Mt. Bachelor | OR | before Dec 6, 2026 | Before Dec 6, 2026: 75% · Before Dec 13, 2026: 60% · Before Dec 20, 2026: 66% · Before Dec 27, 2026: 95% · Before Jan 3, 2027: 86% | Three Creeks Meadow (19 km, 5,680 ft): 0 in on 2026-10-22 | 6,906 |
| Northstar | CA | before Nov 29, 2026 | Before Nov 22, 2026: 49% · Before Nov 29, 2026: 89% · Before Dec 6, 2026: 83% · Before Dec 13, 2026: 94% · Before Dec 20, 2026: 96% | Truckee #2 (6 km, 6,500 ft): 0 in on 2026-10-22 | 2,957 |
| Park City | UT | before Nov 22, 2026 | Before Nov 22, 2026: 62% · Before Nov 29, 2026: 84% · Before Dec 6, 2026: 94% · Before Dec 13, 2026: 96% · Before Dec 20, 2026: 98% | Thaynes Canyon (4 km, 9,260 ft): 0 in on 2026-10-22 | 4,574 |
| Sierra-at-Tahoe | CA | before Dec 27, 2026 | Before Dec 13, 2026: 36% · Before Dec 20, 2026: 36% · Before Dec 27, 2026: 53% · Before Jan 3, 2027: 89% · Before Jan 10, 2027: 91% | Echo Peak (5 km, 7,650 ft): 0 in on 2026-10-22 | 4,757 |
| Snowbasin | UT | before Dec 6, 2026 | Before Nov 22, 2026: 16% · Before Nov 29, 2026: 13% · Before Dec 6, 2026: 86% · Before Dec 13, 2026: 92% · Before Dec 20, 2026: 50% | Ben Lomond Peak (20 km, 7,690 ft): 1 in on 2026-10-22 | 602 |
| Snowbird | UT | before Nov 29, 2026 | Before Nov 22, 2026: 30% · Before Nov 29, 2026: 87% · Before Dec 6, 2026: 99% · Before Dec 13, 2026: 12% · Before Dec 20, 2026: 90% | Snowbird (1 km, 9,170 ft): 0 in on 2026-10-22 | 4,807 |
| Steamboat | CO | before Nov 22, 2026 | Before Nov 15, 2026: 4% · Before Nov 22, 2026: 84% · Before Nov 29, 2026: 94% · Before Dec 6, 2026: 96% · Before Dec 13, 2026: 96% | Dry Lake (8 km, 8,240 ft): 1 in on 2026-10-22 | 6,886 |
| Stowe | VT | before Nov 22, 2026 | Before Nov 15, 2026: 4% · Before Nov 22, 2026: 75% · Before Nov 29, 2026: 80% · Before Dec 6, 2026: 80% · Before Dec 13, 2026: 82% | No SNOTEL station within 40 km | 4,193 |
| Stratton | VT | before Nov 22, 2026 | Before Nov 22, 2026: 57% · Before Nov 29, 2026: 74% · Before Dec 6, 2026: 86% · Before Dec 13, 2026: 96% · Before Dec 20, 2026: 96% | No SNOTEL station within 40 km | 3,715 |
| Sugarbush | VT | before Nov 22, 2026 | Before Nov 15, 2026: 8% · Before Nov 22, 2026: 50% · Before Nov 29, 2026: 78% · Before Dec 6, 2026: 92% · Before Dec 13, 2026: 96% | No SNOTEL station within 40 km | 643 |
| Winter Park | CO | before Nov 8, 2026 | Before Oct 25, 2026: 4% · Before Nov 1, 2026: 20% · Before Nov 8, 2026: 60% · Before Nov 15, 2026: 86% · Before Nov 22, 2026: 94% | Fool Creek (9 km, 11,130 ft): 0 in on 2026-10-22 | 7,055 |
Market middle: for “above X” ladders, the point where the implied chance crosses 50% (prices forced to fall as the threshold rises, interpolated between rungs). Prices are the bid/ask midpoint when the spread is 10¢ or less, otherwise the last trade. Events with fewer than 500 contracts traded show “thin trading” instead of a middle, and ladders whose quoted prices contradict each other show “prices out of order”. Pulled Oct 23, 2026, 10:44 AM ET.
Download the data
Settled city-months (CSV)Open markets vs climatology (CSV)Ski resort opening-date ladders (live) (CSV)
One row per settled city-month, and one row per open threshold contract with its live implied chance and the 1991–2020 base rate. No price histories are included. Free to reuse under CC BY 4.0 with a link back to this page.
Embed this chart
Methodology
- Markets. Kalshi’s monthly snowfall series for Boston (
KXBOSSNOWM), Chicago (KXCHISNOWM), Denver (KXDENSNOWM), Washington, D.C. (KXDCSNOWM), Philadelphia (KXPHILSNOWM), Seattle (KXSEASNOWM), Minneapolis (KXMSPSNOWM), Detroit (KXDETSNOWM), Pittsburgh (KXPITSNOWM), Milwaukee (KXMKESNOWM), each a ladder of “more than X inches” contracts, from Kalshi’s public API. - Official data. Monthly snowfall totals and 1991–2020 normals for each airport station from the NWS/NOAA Regional Climate Centers’ Applied Climate Information System (the same station records behind the NWS Daily Climate Reports). Where a market’s rules named a different station (Chicago Midway for one December 2025 event), we use that station.
- Start-of-month price. Each contract’s price at 1 AM ET on the first day of the month (hourly-candle bid/ask midpoint, or last trade when the spread is wider than 10¢; 48-hour look-back). Prices are forced to fall as the threshold rises; the median is interpolated where the implied chance crosses 50%.
- Climatology. The share of Decembers from 1991 to 2020 with more snow than each threshold, at the same station. It is a base rate, not a forecast; it ignores this winter’s El Niño or La Niña signal and long-term trends.
- Limits. Live December prices come from thinly traded markets and can move sharply on a single trade; last winter is the only settled season for most cities, so the scored sample is small; snow totals are often revised in the days after a storm; The Weather Company’s data can differ from the NWS record, and this season’s markets settle on it. Nothing here is investment advice. Last run: Oct 23, 2026, 10:45 AM ET.
Cite this research
Suggested citation: PredictionScout. (2026, October 23). Snowfall Prediction Markets vs the National Weather Service: 10 Cities. https://predictionscout.com/research/snowfall-prediction-markets-vs-national-weather-service/
For a chart or news story: “Source: PredictionScout analysis of public exchange data (https://predictionscout.com/research/snowfall-prediction-markets-vs-national-weather-service/)”
The data and charts on this page are free to reuse under CC BY 4.0 with a link back to this page. Market data: Kalshi. Snowfall: NOAA/NWS station records via RCC-ACIS.
Data sources: prices and volumes come from the public APIs of Kalshi and Polymarket, with snowfall data from NOAA’s Regional Climate Centers (ACIS). All trademarks belong to their owners. PredictionScout is independent and not affiliated with any exchange. Nothing here is investment, betting, or legal advice.
Related: New York snowfall vs Central Park · hurricane season markets · hottest-year markets vs NASA · All research