Kalshi’s 2026 ladders put the middle of the national House vote at about D+9.4 points and the middle of the seat ladders at about 238 Democratic and 197 Republican seats.
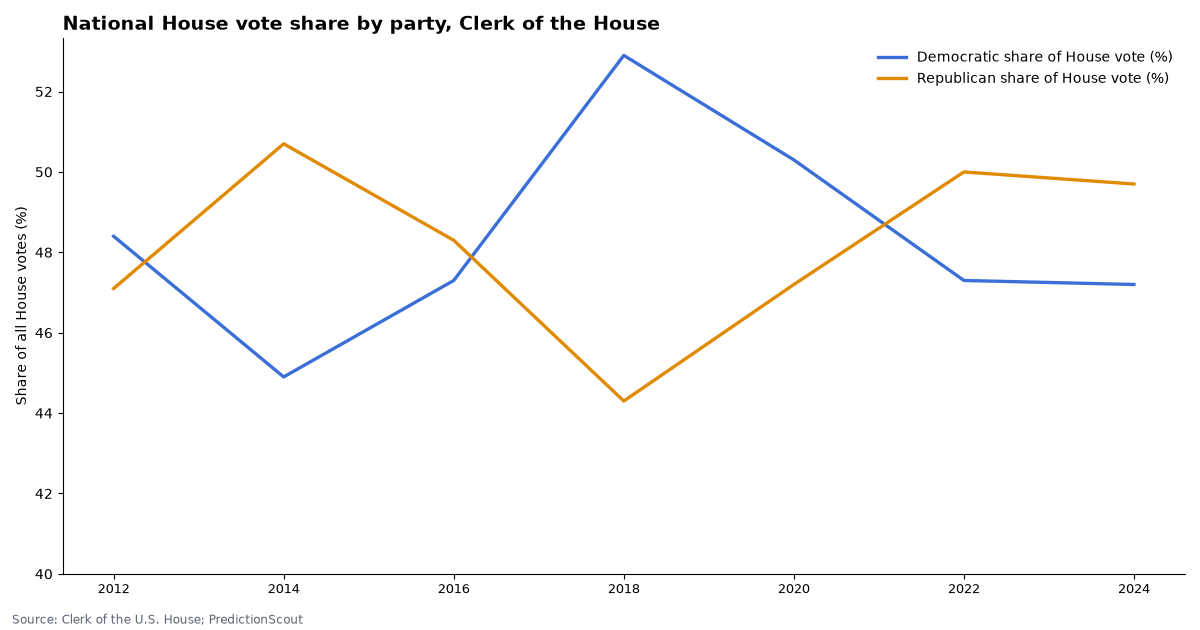
We set those live odds beside the Clerk of the House’s official results for every House election since 2012: total votes by party and seats won. In 2024 the Clerk recorded 74,390,864 Republican and 70,571,330 Democratic votes (R+2.6).
Kalshi market data and Clerk of the House statistics, pulled Oct 23, 2026, 8:36 AM ET. Updated daily.
By Arthur Angelo, PredictionScout Research · Updated Oct 23, 2026, 8:36 AM ET
Key findings
- Popular vote, 2012–2024. The national margin ranged from R+5.8 (2014) to D+8.6 (2018) in the Clerk’s official totals. Kalshi’s most likely 2026 range is “Democrats, 8 to 10%” at 25% (prices scaled to sum to 100%).
- Votes and seats don’t always line up. In 2012, the party with more House votes nationally did not win more seats.
- Seat ladders. The Democratic-seat ladder’s most likely range is Above 249 (17%); the Republican-seat ladder’s is Below 193 (36%). The Democratic ladder gives 218 or more Democratic seats 92%; the Republican ladder gives 218 or more Republican seats 12%. They are separate markets, so the two need not add to exactly 100% (here 104%).
- Consistency check. The middle of the two seat ladders adds to about 435 of 435 seats. The popular-vote ladder gives a Republican popular-vote win 5% and a Democratic one 95%.
- State delegations. California: 48 Democratic seats at 79% (2024: 43 of 52); Florida: Above 10 Democratic seats at 19% (2024: 7 of 28); New York: 20 Democratic seats at 35% (2024: 19 of 26).
- Senate seats won. The middle of the Democratic ladder is about 18.4 seats and of the Republican ladder about 17.6.
Official results, 2012–2024
Votes are the Clerk’s national recapitulation for U.S. Representatives (all states, every party and write-ins in the total). Seats are the Clerk’s “Political Divisions” table, which records the immediate result of each election, before later vacancies and special elections.
| Election | Republican votes | Democratic votes | All votes | Margin (D minus R) | Seats R–D |
|---|---|---|---|---|---|
| 2012 | 57,622,827 | 59,214,910 | 122,346,020 | D+1.3 | 234–200 |
| 2014 | 39,926,526 | 35,368,840 | 78,812,769 | R+5.8 | 247–188 |
| 2016 | 62,772,225 | 61,417,454 | 129,833,250 | R+1.0 | 241–194 |
| 2018 | 50,467,181 | 60,319,623 | 114,016,831 | D+8.6 | 199–235 |
| 2020 | 72,466,576 | 77,122,690 | 153,431,405 | D+3.0 | 212–222 |
| 2022 | 54,227,992 | 51,280,463 | 108,443,387 | R+2.7 | 222–213 |
| 2024 | 74,390,864 | 70,571,330 | 149,543,421 | R+2.6 | 220–215 |
2026 popular-vote margin: live odds
Kalshi’s KXHOUSEPOPVOTEMARGIN-27NOV03 ladder, scaled so its ranges sum to 100%. Each range is the Democratic share minus the Republican share of the national House vote, inclusive of its lower bound; “Republicans win” covers any margin below zero.
| Range | Implied chance (scaled) | Volume |
|---|---|---|
| Republicans win | 5% | 1,035,248 |
| Democrats, 0 to 2% | 2% | 340,832 |
| Democrats, 2 to 4% | 2% | 285,508 |
| Democrats, 4 to 6% | 7% | 185,414 |
| Democrats, 6 to 8% | 15% | 220,746 |
| Democrats, 8 to 10% | 25% | 202,478 |
| Democrats, 10 to 12% | 22% | 204,210 |
| Democrats, 12 to 14% | 12% | 242,551 |
| Democrats, 14 to 16% | 4% | 222,539 |
| Democrats, 16% and above | 4% | 216,477 |
2026 seats: live odds
Two separate ladders, each settled on House membership on February 1, 2027, with members who caucus with a party counted for it. Democratic seats (KXDHOUSESEATS-27):
| Range | Implied chance (scaled) | Volume |
|---|---|---|
| Below 210 | 3% | 454,364 |
| 210-213 | 2% | 282,032 |
| 214-217 | 3% | 325,639 |
| 218-221 | 3% | 258,925 |
| 222-225 | 3% | 221,206 |
| 226-229 | 7% | 216,593 |
| 230-233 | 15% | 235,499 |
| 234-237 | 16% | 232,061 |
| 238-241 | 13% | 232,224 |
| 242-245 | 11% | 246,996 |
| 246-249 | 8% | 274,348 |
| Above 249 | 17% | 738,259 |
Republican seats (KXRHOUSESEATS-27):
| Range | Implied chance (scaled) | Volume |
|---|---|---|
| Below 193 | 36% | 879,976 |
| 193-197 | 16% | 359,049 |
| 198-202 | 18% | 276,693 |
| 203-207 | 5% | 264,656 |
| 208-212 | 8% | 266,059 |
| 213-217 | 5% | 341,012 |
| 218-222 | 6% | 644,502 |
| 223-227 | 3% | 611,740 |
| 228-232 | 1% | 497,766 |
| 233-237 | 1% | 421,130 |
| Above 237 | 2% | 496,323 |
State delegations: how many seats each party wins
Kalshi lists exact-count markets for the number of House seats Democrats win in a state, such as “exactly 48 of California’s 52.” Each settles on the certified winners of that state’s districts in the November 3 election. Prices below are scaled so a state’s brackets add to 100%. The 2024 column is our count of district winners in the Clerk’s certified statistics; several states redrew their maps after 2024, so the comparison is context, not like for like.
| State | Most likely Democratic seats | Chance | Other brackets | 2024 (Clerk): D–R of seats |
|---|---|---|---|---|
| California | 48 | 79% | 47 13%; 49 2%; 46 2% | 43–9 of 52 |
| Florida | Above 10 | 19% | 7 15%; 6 13%; 4 13% | 7–20 of 28 (1 uncontested, no vote listed) |
| New York | 20 | 35% | 19 30%; 21 14%; 18 6% | 19–7 of 26 |
| Illinois | 14 | 90% | Above 14 5%; 13 3%; 12 1% | 14–3 of 17 |
| Pennsylvania | 11 | 36% | 10 30%; 9 19%; 8 6% | 7–10 of 17 |
| Ohio | 6 | 35% | 5 23%; 7 17%; 4 10% | 5–10 of 15 |
| Georgia | 5 | 88% | 6 4%; Below 5 4%; 7 2% | 5–9 of 14 |
| North Carolina | 5 | 44% | 4 18%; Above 7 12%; 3 10% | 4–10 of 14 |
| Michigan | 9 | 36% | 8 27%; 7 19%; 6 13% | 6–7 of 13 |
| New Jersey | 10 | 73% | Above 10 17%; 9 7%; 8 2% | 9–3 of 12 |
| Arizona | 5 | 56% | 6 18%; 4 17%; 3 5% | 3–6 of 9 |
| Tennessee | 0 | 81% | 1 13%; 2 3%; Above 2 2% | 1–8 of 9 |
| Minnesota | 4 | 71% | 5 26%; Above 5 2%; 3 1% | 4–4 of 8 |
| South Carolina | 1 | 66% | 2 27%; Above 2 6%; 0 1% | 1–6 of 7 |
| Alabama | 1 | 73% | 2 25%; 0 1%; Above 2 1% | 2–5 of 7 |
| Louisiana | 1 | 90% | 2 4%; Above 2 3%; 0 2% | 2–4 of 6 |
| Nevada | 3 | 68% | 4 28%; 2 3%; Below 2 2% | 3–1 of 4 |
| Iowa | Above 2 | 58% | 2 25%; 1 10%; 0 7% | 0–4 of 4 |
| Utah | 1 | 87% | 2 8%; 0 2%; Above 2 2% | 0–4 of 4 |
Senate seats won in 2026
Two more ladders count how many of the 2026 Senate races each party wins (not the size of the Senate afterward). Each settles on certified results; “middle” is where the ladder crosses 50%.
| Ladder | Chances (at least…) | Middle |
|---|---|---|
| Democratic seats won | 12+: 96%, 13+: 96%, 14+: 94%, 15+: 89%, 16+: 82%, 17+: 70%, 18+: 57%, 19+: 37%, 20+: 23%, 21+: 14%, 22+: 6% | 18.4 |
| Republican seats won | 14+: 90%, 15+: 84%, 16+: 73%, 17+: 60%, 18+: 42%, 19+: 32%, 20+: 20%, 21+: 14%, 22+: 7%, 23+: 2%, 24+: 2%, 25+: 2% | 17.6 |
Download the data
Official House vote and seats, 2012-2024 (CSV)Kalshi 2026 House ladders today (CSV)State delegation ladders today (CSV)
Official vote totals and seats for 2012-2024, plus today’s scaled ladder odds. No price histories are included. Free to reuse under CC BY 4.0 with a link back to this page.
Embed this chart
Methodology
- Votes. The national “Recapitulation of Votes Cast for United States Representatives” in each of the Clerk’s Statistics of the Congressional Election reports, which compile official state returns. Shares use all House votes, including minor parties and write-ins. Uncontested races where a state prints no vote reduce both parties’ totals and are left as the Clerk reports them.
- Seats. The Clerk’s Political Divisions table in the 2024 report (immediate results of elections). Kalshi’s seat markets instead count membership on February 1, 2027, including members who caucus with a party, so the two can differ.
- Live odds. Each range priced at the bid/ask midpoint (or last trade when the spread is wide), then scaled so a ladder sums to 100%. The middle value interpolates within the range where the running total passes 50%.
- Kalshi’s source. The popular-vote contract terms point to the official certifying authorities; the national total is final only once every state certifies.
- Limits. No 2026 market has settled yet; we compare live odds with past official results, which is context, not a forecast check. The Clerk publishes each report months after the election. Seat counts are immediate results, not membership on any later date. Nothing here is investment advice. Last run: Oct 23, 2026, 8:36 AM ET.
Cite this research
Suggested citation: PredictionScout. (2026, October 23). House Popular Vote and Seat Prediction Markets vs Official Results. https://predictionscout.com/research/house-popular-vote-seats-prediction-markets/
For a chart or news story: “Source: PredictionScout analysis of public exchange data (https://predictionscout.com/research/house-popular-vote-seats-prediction-markets/)”
The data and charts on this page are free to reuse under CC BY 4.0 with a link back to this page. Market data: Kalshi. Votes and seats: Clerk of the U.S. House of Representatives.
Data sources: prices and volumes come from the public APIs of Kalshi and Polymarket, with official results from the Clerk of the House. All trademarks belong to their owners. PredictionScout is independent and not affiliated with any exchange. Nothing here is investment, betting, or legal advice.
Related: international election markets · FOMC dissent markets · All research