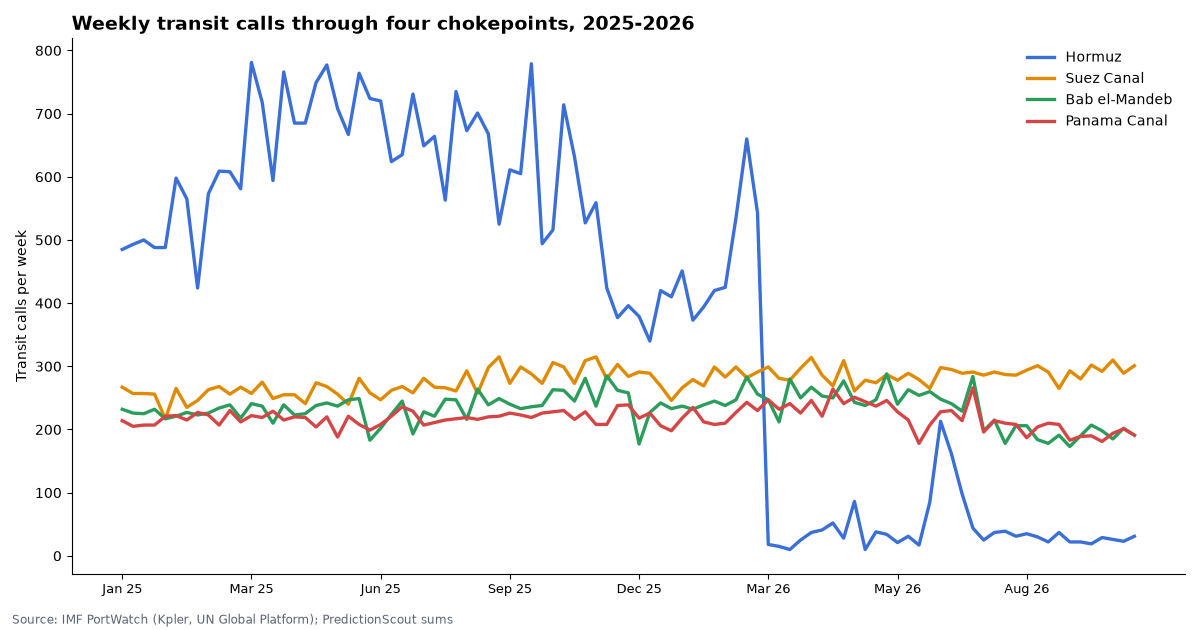
IMF PortWatch counted 31 transit calls through the Strait of Hormuz in the week of Oct 26, 2026, against a 2025 weekly average of 598.
Kalshi lists weekly markets on ship transits through four chokepoints and settles them on IMF PortWatch’s daily counts. We re-added the same days from PortWatch for every settled week since Apr 20, 2026: 45 of 67 settlements match today’s PortWatch totals.
Kalshi market data and IMF PortWatch daily transit calls, pulled Nov 8, 2026, 8:16 AM ET. Updated daily (PortWatch updates Tuesdays).
By Arthur Angelo, PredictionScout Research · Updated Nov 8, 2026, 8:16 AM ET
Key findings
- 45 of 67 settlements match today’s PortWatch data. For those weeks, the total Kalshi settled on equals the sum of PortWatch’s daily transit calls for the same Monday–Sunday week as published today. The other 22 differ from today’s figures, by a median of 8 transits. Kalshi’s terms fix the number at expiration and ignore later revisions, so any later change to PortWatch’s daily counts would show up as a gap like these; we cannot see PortWatch’s figures as first published, so we show both.
- The market beat “same as last week” in 32 of 55 weeks. At the start of each week, the market’s median missed the final count by a median 6.6%; simply repeating the previous week’s total missed by 8.2%.
- Traffic against 2025. Latest full week vs the 2025 weekly average: Hormuz 31 vs 598 (-95%); Suez Canal 301 vs 270 (+12%); Bab el-Mandeb 191 vs 234 (-18%); Panama Canal 191 vs 218 (-12%).
- Contracts. Of 461 “above X” contracts priced at the start of their week, the side above 50¢ was right 392 times (85%).
- Port of NY/NJ: 5.98 million TEUs through August (-1.07% y/y); the 2026 market crosses 50% at 8.86 million (port).
How the chokepoint markets work
Each week Kalshi lists a ladder of “more than X transit calls” contracts for a chokepoint. A transit call is one ship passing through, as detected by PortWatch from ships’ satellite-tracked AIS signals. Each contract pays $1 if the week’s total is above its line. The week runs Monday to Sunday, and the total is the sum of PortWatch’s daily counts. PortWatch updates weekly, on Tuesdays at 9 AM ET, so the markets settle no earlier than the Tuesday after the week ends.
What drives the number. Security incidents and insurance costs (the Red Sea and the Gulf), canal restrictions (the Panama Canal’s depend on water levels in Gatun Lake), and the normal ebb and flow of tanker and container schedules. PortWatch counts are estimates from AIS data: ships that switch off their transponders are not counted, and any change PortWatch makes to a day’s count after a contract expires does not affect that contract.
Reading the tables. “Market median” is the count where the implied chance crosses 50%, from prices at the start of the week (or one hour after the market opened, if later). “Previous week” is the naive forecast we compare it with. Our PortWatch total is today’s sum of the same seven days.
A worked example. For the Suez Canal in the week of Oct 26, 2026, the market median at the start of the week was 297 transit calls; the week before had 289. Kalshi settled on 301, so the market was closer than repeating last week.
This week’s markets vs PortWatch so far
| Chokepoint | Week | Market median now | PortWatch so far | Previous week | Implied chance by line |
|---|---|---|---|---|---|
| Strait of Hormuz | Nov 2, 2026 – Nov 8, 2026 | 23 | 0 (0 of 7 days) | 31 | >15: 98%; >20: 82%; >23: 44%; >25: 23%; >27: 11%; >30: 6% |
| Suez Canal | Nov 2, 2026 – Nov 8, 2026 | 295 | 0 (0 of 7 days) | 301 | >270: 96%; >280: 84%; >290: 62%; >300: 38%; >310: 18%; >320: 6% |
| Bab el-Mandeb Strait | Nov 2, 2026 – Nov 8, 2026 | 193 | 0 (0 of 7 days) | 191 | >160: 96%; >170: 96%; >180: 90%; >185: 74%; >190: 60%; >195: 45%; >200: 30%; >205: 22%; >210: 14%; >220: 6% |
| Panama Canal | Nov 2, 2026 – Nov 8, 2026 | 193 | 0 (0 of 7 days) | 191 | >170: 98%; >180: 94%; >185: 86%; >190: 62%; >195: 42%; >200: 15%; >205: 4% |
Live Kalshi prices as of the update time. PortWatch data lags by several days, so “so far” usually covers only part of the week. Sources: Kpler; UN Global Platform; IMF PortWatch (portwatch.imf.org).
Every settled week
| Chokepoint | Week (Mon–Sun) | Market median, start of week | Kalshi settled on | PortWatch total today | Previous week (PortWatch) | Contracts right | Contracts traded |
|---|---|---|---|---|---|---|---|
| Suez Canal | Oct 26, 2026 – Nov 1, 2026 | 297 | 301 | 301 ✓ | 289 | 7/8 | 154,452 |
| Strait of Hormuz | Oct 26, 2026 – Nov 1, 2026 | 25 | 31 | 31 ✓ | 23 | 7/9 | 312,338 |
| Panama Canal | Oct 26, 2026 – Nov 1, 2026 | 196 | 191 | 191 ✓ | 201 | 8/9 | 199,732 |
| Bab el-Mandeb Strait | Oct 26, 2026 – Nov 1, 2026 | 189 | 191 | 191 ✓ | 202 | 10/11 | 200,648 |
| Suez Canal | Oct 19, 2026 – Oct 25, 2026 | 306 | 289 | 289 ✓ | 310 | 6/8 | 126,472 |
| Strait of Hormuz | Oct 19, 2026 – Oct 25, 2026 | 23 | 23 | 23 ✓ | 26 | 7/7 | 330,490 |
| Panama Canal | Oct 19, 2026 – Oct 25, 2026 | 191 | 201 | 201 ✓ | 194 | 7/9 | 201,163 |
| Bab el-Mandeb Strait | Oct 19, 2026 – Oct 25, 2026 | 187 | 202 | 202 ✓ | 185 | 8/11 | 202,991 |
| Suez Canal | Oct 12, 2026 – Oct 18, 2026 | 287 | 310 | 310 ✓ | 292 | 6/8 | 258,905 |
| Strait of Hormuz | Oct 12, 2026 – Oct 18, 2026 | 23 | 26 | 26 ✓ | 29 | 10/11 | 463,567 |
| Panama Canal | Oct 12, 2026 – Oct 18, 2026 | 189 | 194 | 194 ✓ | 181 | 8/9 | 173,314 |
| Bab el-Mandeb Strait | Oct 12, 2026 – Oct 18, 2026 | 190 | 185 | 185 ✓ | 198 | 10/11 | 196,197 |
| Suez Canal | Oct 5, 2026 – Oct 11, 2026 | 284 | 292 | 292 ✓ | 302 | 4/5 | 23,257 |
| Strait of Hormuz | Oct 5, 2026 – Oct 11, 2026 | 24 | 29 | 29 ✓ | 19 | 10/11 | 472,300 |
| Panama Canal | Oct 5, 2026 – Oct 11, 2026 | 190 | 181 | 181 ✓ | 190 | 5/5 | 95,213 |
| Bab el-Mandeb Strait | Oct 5, 2026 – Oct 11, 2026 | 185 | 198 | 198 ✓ | 207 | 5/5 | 81,881 |
| Suez Canal | Sep 28, 2026 – Oct 4, 2026 | 290 | 302 | 302 ✓ | 280 | 2/3 | 15,071 |
| Strait of Hormuz | Sep 28, 2026 – Oct 4, 2026 | 23 | 19 | 19 ✓ | 22 | 10/11 | 376,765 |
| Panama Canal | Sep 28, 2026 – Oct 4, 2026 | 203 | 190 | 190 ✓ | 189 | 4/4 | 66,485 |
| Bab el-Mandeb Strait | Sep 28, 2026 – Oct 4, 2026 | 188 | 207 | 207 ✓ | 190 | 4/5 | 78,600 |
| Suez Canal | Sep 21, 2026 – Sep 27, 2026 | 276 | 280 | 280 ✓ | 293 | 5/5 | 29,702 |
| Strait of Hormuz | Sep 21, 2026 – Sep 27, 2026 | 26 | 22 | 22 ✓ | 22 | 10/11 | 418,237 |
| Panama Canal | Sep 21, 2026 – Sep 27, 2026 | 208 | 189 | 189 ✓ | 183 | 4/5 | 62,024 |
| Bab el-Mandeb Strait | Sep 21, 2026 – Sep 27, 2026 | 179 | 190 | 190 ✓ | 173 | 5/5 | 94,083 |
| Suez Canal | Sep 14, 2026 – Sep 20, 2026 | 291 | 293 | 293 ✓ | 265 | 5/5 | 14,327 |
| Strait of Hormuz | Sep 14, 2026 – Sep 20, 2026 | 30 | 22 | 22 ✓ | 37 | 9/11 | 317,587 |
| Panama Canal | Sep 14, 2026 – Sep 20, 2026 | 207 | 183 | 183 ✓ | 208 | 4/5 | 58,789 |
| Bab el-Mandeb Strait | Sep 14, 2026 – Sep 20, 2026 | 169 | 173 | 173 ✓ | 191 | 5/5 | 39,779 |
| Suez Canal | Sep 7, 2026 – Sep 13, 2026 | 295 | range >260 to ≤270 | 265 ✓ | 291 | 2/5 | 7,556 |
| Strait of Hormuz | Sep 7, 2026 – Sep 13, 2026 | 23 | range >35 to ≤40 | 37 ✓ | 22 | 8/11 | 245,651 |
| Bab el-Mandeb Strait | Sep 7, 2026 – Sep 13, 2026 | 201 | range >175 to ≤200 | 191 ✓ | 178 | 4/5 | 18,177 |
| Suez Canal | Aug 31, 2026 – Sep 6, 2026 | 295 | range >290 to ≤300 | 291 ✓ | 301 | 5/5 | 2,425 |
| Strait of Hormuz | Aug 31, 2026 – Sep 6, 2026 | 30 | range >20 to ≤25 | 22 ✓ | 30 | 10/11 | 55,106 |
| Bab el-Mandeb Strait | Aug 31, 2026 – Sep 6, 2026 | 209 | range >175 to ≤200 | 178 ✓ | 184 | 4/5 | 3,636 |
| Suez Canal | Aug 24, 2026 – Aug 30, 2026 | 287 | 301 | 301 ✓ | 294 | 3/5 | 10,623 |
| Strait of Hormuz | Aug 24, 2026 – Aug 30, 2026 | 30 | 30 | 30 ✓ | 35 | 10/11 | 96,378 |
| Panama Canal | Aug 24, 2026 – Aug 30, 2026 | 212 | 204 | 204 ✓ | 187 | 5/5 | 2,614 |
| Bab el-Mandeb Strait | Aug 24, 2026 – Aug 30, 2026 | 193 | 184 | 184 ✓ | 206 | 5/5 | 4,420 |
| Suez Canal | Aug 17, 2026 – Aug 23, 2026 | 288 | 294 | 294 ✓ | 286 | 4/5 | 6,244 |
| Strait of Hormuz | Aug 17, 2026 – Aug 23, 2026 | 26 | 35 | 35 ✓ | 31 | 10/11 | 108,479 |
| Panama Canal | Aug 17, 2026 – Aug 23, 2026 | 213 | 187 | 187 ✓ | 208 | 4/5 | 2,025 |
| Bab el-Mandeb Strait | Aug 17, 2026 – Aug 23, 2026 | 187 | 206 | 206 ✓ | 206 | 4/5 | 7,076 |
| Suez Canal | Aug 10, 2026 – Aug 16, 2026 | 288 | 286 | 286 ✓ | 287 | 5/5 | 2,426 |
| Strait of Hormuz | Aug 10, 2026 – Aug 16, 2026 | 33 | 25 | 31 differs | 39 | 11/12 | 67,617 |
| Panama Canal | Aug 10, 2026 – Aug 16, 2026 | 212 | 208 | 208 ✓ | 210 | 4/4 | 850 |
| Bab el-Mandeb Strait | Aug 10, 2026 – Aug 16, 2026 | 185 | 205 | 206 differs | 178 | 4/5 | 2,349 |
| Suez Canal | Aug 3, 2026 – Aug 9, 2026 | 285 | 286 | 287 differs | 291 | 5/5 | 1,519 |
| Strait of Hormuz | Aug 3, 2026 – Aug 9, 2026 | 65 | 31 | 39 differs | 37 | 7/13 | 174,689 |
| Panama Canal | Aug 3, 2026 – Aug 9, 2026 | 205 | 210 | 210 ✓ | 214 | 5/5 | 2,906 |
| Bab el-Mandeb Strait | Aug 3, 2026 – Aug 9, 2026 | 180 | 176 | 178 differs | 215 | 5/5 | 6,949 |
| Suez Canal | Jul 27, 2026 – Aug 2, 2026 | 288 | 285 | 291 differs | 286 | 5/5 | 1,732 |
| Strait of Hormuz | Jul 27, 2026 – Aug 2, 2026 | 29 | 27 | 37 differs | 25 | 11/12 | 118,116 |
| Panama Canal | Jul 27, 2026 – Aug 2, 2026 | — | 213 | 214 differs | 196 | 1,144 | |
| Bab el-Mandeb Strait | Jul 27, 2026 – Aug 2, 2026 | — | 208 | 215 differs | 198 | 10,745 | |
| Strait of Hormuz | Jul 20, 2026 – Jul 26, 2026 | 37 | 17 | 25 differs | 44 | 8/10 | 379,422 |
| Strait of Hormuz | Jul 13, 2026 – Jul 19, 2026 | 77 | 85 | 44 differs | 98 | 9/9 | 313,178 |
| Strait of Hormuz | Jul 6, 2026 – Jul 12, 2026 | — | 115 | 98 differs | 162 | 446,372 | |
| Strait of Hormuz | Jun 29, 2026 – Jul 5, 2026 | 194 | 225 | 162 differs | 213 | 9/10 | 242,258 |
| Strait of Hormuz | Jun 22, 2026 – Jun 28, 2026 | 54 | 228 | 213 differs | 85 | 1/2 | 217,054 |
| Strait of Hormuz | Jun 15, 2026 – Jun 21, 2026 | above 100 | 92 | 85 differs | 17 | 9/10 | 223,917 |
| Strait of Hormuz | Jun 8, 2026 – Jun 14, 2026 | — | 18 | 17 differs | 31 | 175,816 | |
| Strait of Hormuz | May 25, 2026 – May 31, 2026 | 45 | 33 | 21 differs | 34 | 9/10 | 174,715 |
| Strait of Hormuz | May 18, 2026 – May 24, 2026 | 21 | 42 | 34 differs | 38 | 7/10 | 257,963 |
| Strait of Hormuz | May 11, 2026 – May 17, 2026 | above 25 | 15 | 38 differs | 10 | 2/3 | 134,420 |
| Strait of Hormuz | May 4, 2026 – May 10, 2026 | 128 | 11 | 10 differs | 86 | 3/9 | 362,668 |
| Strait of Hormuz | Apr 27, 2026 – May 3, 2026 | 49 | 40 | 86 differs | 28 | 2/2 | 245,218 |
| Strait of Hormuz | Apr 20, 2026 – Apr 26, 2026 | 50 | 37 | 28 differs | 52 | 8/9 | 543,773 |
Sources: Kpler; UN Global Platform; IMF PortWatch (portwatch.imf.org). Weekly totals are PredictionScout’s sums of PortWatch’s daily transit calls; that summing is the only transformation.
Port of New York and New Jersey container volume
Kalshi asks whether the port will handle more than a set number of TEUs (twenty-foot equivalent units, the standard container measure) in 2026. It settles on the Port Authority of New York and New Jersey’s reported calendar-year total, which counts loaded and empty containers, imports and exports.
The Port Authority reports 5,983,310 TEUs for January through August 2026, -1.07% from the same months of 2025; August alone was 789,875. A straight monthly average carries that to about 8.97 million for the year. The last four months usually include the pre-holiday import peak (September and October) and a slower November and December.
What moves it. Tariff timing (importers pull shipments forward before increases and pause after), East Coast labor contracts, retail inventory plans, and diversions from West Coast ports or the Panama and Suez routes tracked above. Worked example. To top 8.9 million, the port needs about 729,172 TEUs a month from September to December, compared with an average of 747,914 so far.
| 2026 total | Chance | Contracts traded |
|---|---|---|
| Above 8.4 million TEUs | 96% | 3,901 |
| Above 8.5 million TEUs | 94% | 3,739 |
| Above 8.6 million TEUs | 94% | 39,647 |
| Above 8.7 million TEUs | 84% | 47,534 |
| Above 8.8 million TEUs | 74% | 48,084 |
| Above 8.9 million TEUs | 36% | 40,419 |
| Above 9.0 million TEUs | 18% | 38,500 |
| Above 9.1 million TEUs | 4% | 45,625 |
| Above 9.2 million TEUs | 2% | 6,386 |
Market middle: for “above X” ladders, the point where the implied chance crosses 50% (prices forced to fall as the threshold rises, interpolated between rungs). Prices are the bid/ask midpoint when the spread is 10¢ or less, otherwise the last trade. Events with fewer than 500 contracts traded show “thin trading” instead of a middle, and ladders whose quoted prices contradict each other show “prices out of order”. Pulled Nov 8, 2026, 8:15 AM ET.
Download the data
Settled weeks (CSV)Weekly PortWatch totals (CSV)Port of NY/NJ TEU market (live) (CSV)
One row per settled chokepoint-week, and weekly PortWatch totals since January 2025. PortWatch-derived columns are subject to the IMF’s terms for statistical data, not CC BY; cite “Sources: Kpler; UN Global Platform; IMF PortWatch (portwatch.imf.org)”. No price histories are included. Free to reuse under CC BY 4.0 with a link back to this page.
Embed this chart
Methodology
- Markets. Kalshi’s weekly Strait of Hormuz (
KXHORMUZWEEKLY), Suez Canal (KXSUEZWEEKLY), Bab el-Mandeb Strait (KXBABELMANDEBWEEKLY), Panama Canal (KXPANAMAWEEKLY) series, from Kalshi’s public API. Their rules name IMF PortWatch and define the total as the sum of daily counts over the stated week. - Official data. Daily transit calls (
n_total) from IMF PortWatch’s public Daily Chokepoint Transit Calls layer. Sources: Kpler; UN Global Platform; IMF PortWatch (portwatch.imf.org). PortWatch data are published under the IMF’s terms for statistical data, not CC BY; our only change is summing days into weeks. - Prices. Each contract’s price at midnight ET at the start of its week, or one hour after the market opened if later (hourly-candle bid/ask midpoint, or last trade when the spread is wider than 10¢; 48-hour look-back). Prices are forced to fall as the line rises; the median is interpolated where the implied chance crosses 50%.
- Benchmark. The previous week’s PortWatch total, as published today.
- Limits. PortWatch counts are AIS-based estimates and can be revised; ships that turn off their transponders are missed; only a few months of weekly markets have settled, most with thin trading. Nothing here is investment advice. Last run: Nov 8, 2026, 8:16 AM ET.
Cite this research
Suggested citation: PredictionScout. (2026, November 8). Shipping Chokepoint Prediction Markets vs IMF PortWatch: Hormuz, Suez, Bab el-Mandeb, Panama. https://predictionscout.com/research/shipping-chokepoint-prediction-markets-imf-portwatch/
For a chart or news story: “Source: PredictionScout analysis of public exchange data (https://predictionscout.com/research/shipping-chokepoint-prediction-markets-imf-portwatch/)”
The data and charts on this page are free to reuse under CC BY 4.0 with a link back to this page. Market data: Kalshi. Transit data: Sources: Kpler; UN Global Platform; IMF PortWatch (portwatch.imf.org); IMF PortWatch data remain subject to IMF terms.
Data sources: prices and volumes come from the public APIs of Kalshi and Polymarket, with transit data from IMF PortWatch (Kpler; UN Global Platform; IMF PortWatch (portwatch.imf.org)). All trademarks belong to their owners. PredictionScout is independent and not affiliated with any exchange. Nothing here is investment, betting, or legal advice.
Related: oil markets vs EIA · state gas prices · markets vs official numbers · All research