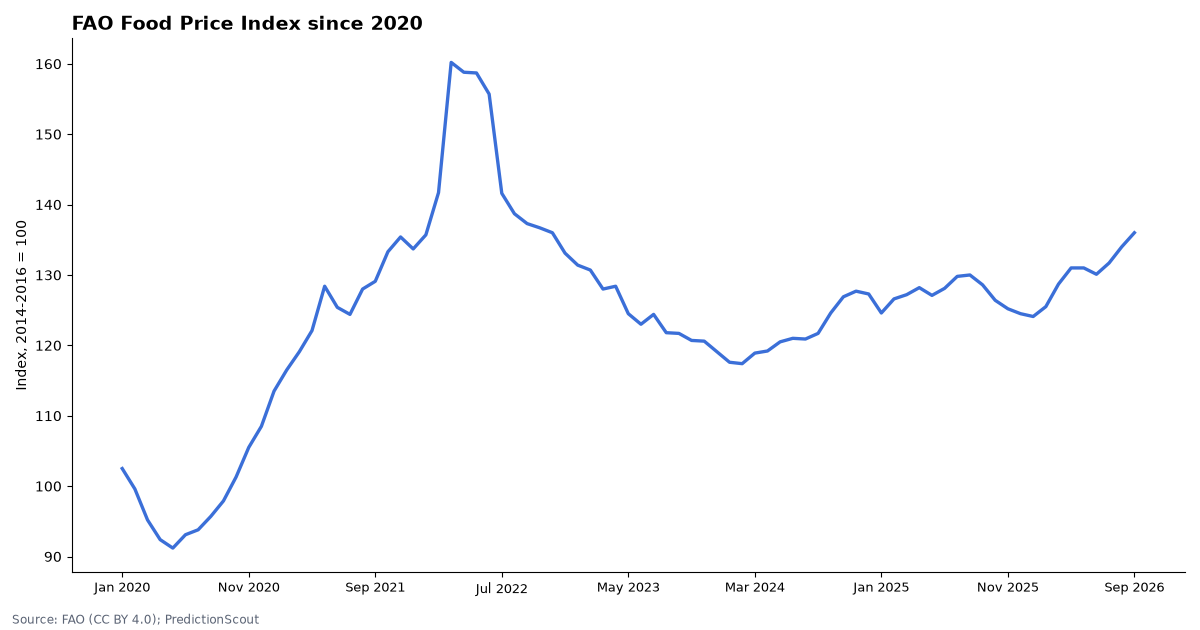
FAO’s Food Price Index stood at 136 in Sep 2026 (2014–2016 = 100), +5.8% from a year earlier.
We checked 5 settled months of Kalshi’s FAO Food Price Index ladder against FAO’s own data file. A day before each release, the market’s median missed the first-reported figure by a median 1.2 points.
Kalshi market data and FAO, pulled Oct 23, 2026, 8:37 AM ET. Updated daily.
By Arthur Angelo, PredictionScout Research · Updated Oct 23, 2026, 8:37 AM ET
Key findings
- Market accuracy. Over 5 months, contracts on the favored side a day before were right 39 of 46; the median miss was 1.2 index points and the largest 1.7 (Aug 2026).
- FAO revises. For 4 of 5 settled months, FAO’s figure today differs from the one Kalshi settled on (median gap 0.4 points). Kalshi’s terms settle on the first-reported value and ignore later revisions; we can; FAO updates recent months as new price quotes arrive.rsquo;t see FAO; FAO updates recent months as new price quotes arrive.rsquo;s first-published file to say why each month moved.
- Behind the headline. Year-on-year in Sep 2026: oils +18.3%, cereals +17.2%, sugar +14.7%, meat +0.0%, dairy -19.1%.
- Next release (Oct 2026). Kalshi’s ladder implies a median of 134.6; trading closes Nov 6, 2026.
Every settled month
The median is read from Kalshi’s “above X” ladder 24 hours before trading closed. “FAO today” is the value in FAO’s current data file.
| Month | Kalshi median, 24h before | Kalshi settled | FAO today | Favored side right |
|---|---|---|---|---|
| May 2026 | 132.1 | 130.8 | 131 | 8/10 |
| Jun 2026 | 129.8 | 130.3 | 130.1 | 6/7 |
| Jul 2026 | 129.9 | 131.1 | 131.7 | 7/9 |
| Aug 2026 | 131.6 | 133.3 | 134 | 8/10 |
| Sep 2026 | 135.6 | 136 | 136 | 10/10 |
Next release: live ladder
| Above | Chance now | Volume |
|---|---|---|
| 131 | 90% | 0 |
| 132 | 78% | 13 |
| 133 | 66% | 919 |
| 134 | 59% | 400 |
| 135 | 45% | 313 |
| 136 | 29% | 255 |
| 137 | 16% | 73 |
| 138 | 8% | 0 |
| 139 | 4% | 240 |
| 140 | 4% | 356 |
FAO’s release dates: 2026: 9 January, 6 February, 6 March, 3 April, 8 May, 5 June, 3 July, 7 August, 4 September, 2 October, 6 November, 4 December.
FAO data and terms
FAO’s figures on this page are used under the CC BY 4.0 licence and FAO’s Statistical Database Terms of Use. FAO has not reviewed or endorsed this analysis or any market. Citation: FAO. 2026. FAO Food Price Index. Accessed on 23 October 2026. https://www.fao.org/worldfoodsituation/foodpricesindex/en/ Licence: CC-BY-4.0.
Download the data
Settled Kalshi FAO ladders vs FAO (CSV)FAO Food Price Index and sub-indices since 2020 (CSV)
Settled months with market medians and both values, plus FAO’s index and sub-indices since 2020. FAO-derived columns are FAO data under CC BY 4.0 and FAO’s database terms; cite as: FAO. 2026. FAO Food Price Index. Accessed on 23 October 2026. https://www.fao.org/worldfoodsituation/foodpricesindex/en/ Licence: CC-BY-4.0. No price histories are included. Free to reuse under CC BY 4.0 with a link back to this page.
Embed this chart
Methodology
- FAO data. The monthly nominal index file (food_price_indices_data.csv) linked from FAO’s Food Price Index page, read on every update.
- Market. Kalshi’s
KXFAOFPIladder, which settles on the headline index as first reported, ignoring later revisions. - Median. Each settled “above X” contract priced from hourly candles 24 hours before trading closed (bid/ask midpoint, or last trade when the spread is wider than 10¢), forced to fall as X rises, and read at 50%.
- Limits. Kalshi’s ladder covers only recent months. FAO’s file shows today’s values, not each first release, so a revision gap is inferred from Kalshi’s settled value. Nothing here is investment advice. Last run: Oct 23, 2026, 8:37 AM ET.
Cite this research
Suggested citation: PredictionScout. (2026, October 23). FAO Food Price Index Prediction Markets vs FAO Data. https://predictionscout.com/research/fao-food-price-index-prediction-markets/
For a chart or news story: “Source: PredictionScout analysis of public exchange data (https://predictionscout.com/research/fao-food-price-index-prediction-markets/)”
The data and charts on this page are free to reuse under CC BY 4.0 with a link back to this page. Market data: Kalshi. Food prices: FAO. 2026. FAO Food Price Index. Accessed on 23 October 2026. https://www.fao.org/worldfoodsituation/foodpricesindex/en/ Licence: CC-BY-4.0.
Data sources: prices and volumes come from the public APIs of Kalshi and Polymarket, with index data from FAO (CC BY 4.0). All trademarks belong to their owners. PredictionScout is independent and not affiliated with any exchange. Nothing here is investment, betting, or legal advice.
Related: egg price markets · international data markets · All research