61%
of 1,033,856 sampled Kalshi trades from Oct 16, 2026 to Nov 12, 2026 had the taker (the side whose order filled immediately) positioned for Yes. Weighted by contracts, the Yes share is 61%.
Kalshi public trade feed, hourly samples Oct 16, 2026 to Nov 12, 2026, pulled Nov 12, 2026, 8:02 AM ET. Updated daily.
By Arthur Angelo, PredictionScout Research · Updated Nov 12, 2026, 8:02 AM ET
Key findings
- Takers were positioned for Yes in 61% of trades and 61% of contracts (28 days, 644 hourly samples).
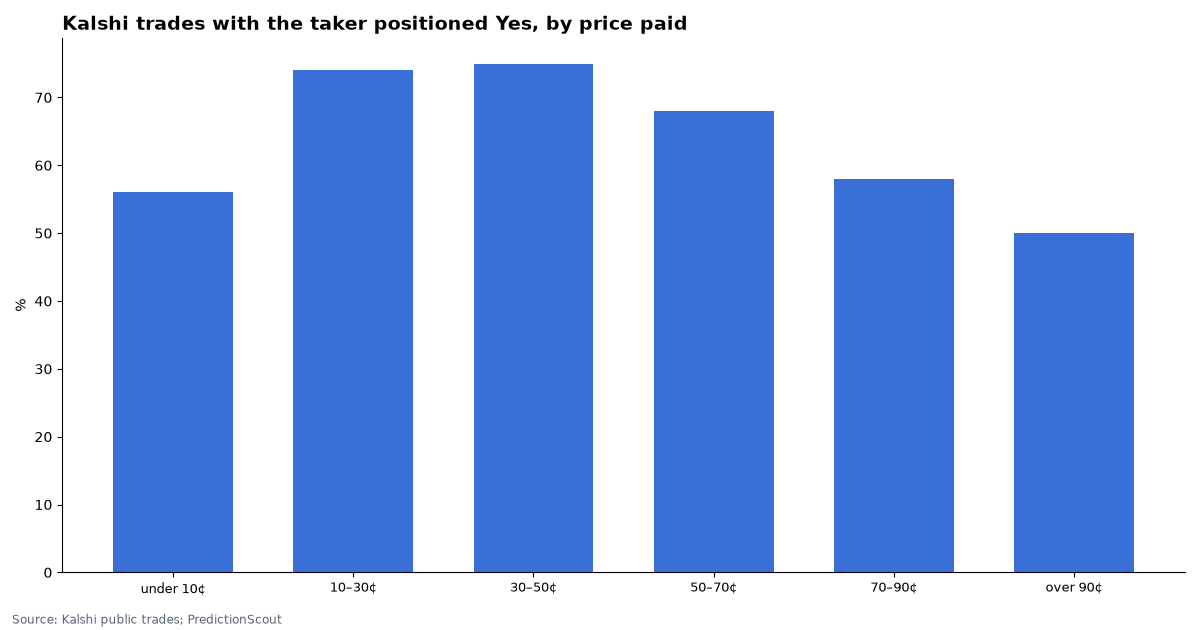
- 26% of trades had the taker paying under 10¢ (a long shot) and 24% paying over 90¢ (a near-certainty). Among the long-shot buys, 56% were Yes; among the over-90¢ buys, 50% were Yes.
- Sports: 71% of taker trades positioned for Yes, from 492,634 trades.
- Commodities: 50% of taker trades positioned for Yes, from 232,409 trades.
- Crypto: 52% of taker trades positioned for Yes, from 227,639 trades.
- Financials: 50% of taker trades positioned for Yes, from 31,133 trades.
By the price the taker paid
“Price paid” is the price of the side the taker took: the Yes price for a Yes taker, the No price for a No taker. The sample window is Oct 16, 2026 to Nov 12, 2026 (28 days).
| Price paid | Trades | Share of trades | Taker positioned Yes (trades) | Taker positioned Yes (contracts) |
|---|---|---|---|---|
| under 10¢ | 264,857 | 26% | 56% | 59% |
| 10–30¢ | 122,379 | 12% | 74% | 78% |
| 30–50¢ | 134,358 | 13% | 75% | 75% |
| 50–70¢ | 140,373 | 14% | 68% | 67% |
| 70–90¢ | 122,253 | 12% | 58% | 63% |
| over 90¢ | 249,636 | 24% | 50% | 49% |
By category
Categories are Kalshi’s own series categories. Categories with fewer than 500 sampled trades are left out of the table but counted in the totals.
| Category | Trades | Taker Yes (trades) | Taker Yes (contracts) | Taker paid 50¢ or more |
|---|---|---|---|---|
| Sports | 492,634 | 71% | 71% | 50% |
| Commodities | 232,409 | 50% | 51% | 60% |
| Crypto | 227,639 | 52% | 56% | 33% |
| Financials | 31,133 | 50% | 47% | 73% |
| Climate and Weather | 23,395 | 54% | 58% | 59% |
| Elections | 14,404 | 67% | 76% | 44% |
| Mentions | 3,768 | 70% | 57% | 45% |
| Politics | 2,545 | 54% | 49% | 49% |
| Entertainment | 2,509 | 57% | 64% | 50% |
| Economics | 2,314 | 59% | 64% | 60% |
| Science and Technology | 669 | 53% | 37% | 64% |
How to read taker flow
Every trade has a maker, whose resting order was already on the book, and a taker, whose order crossed the spread and filled immediately. Kalshi’s public trade feed reports which outcome the taker ended up positioned for: buying Yes and selling No both count as Yes; buying No and selling Yes both count as No. A Yes share above 50% means takers more often wanted Yes exposure; it does not say whether they were right, and the maker on the other side of each trade took the opposite position at the same price.
What moves it
- Market mix. Sports and short-dated crypto and weather markets dominate trade counts at different hours, so the time of day and the sports calendar change the totals.
- News. Scores, data releases and headlines bring bursts of one-sided taking.
- Closing a position. A trader exiting a Yes position by selling it is recorded as a No taker, so the share mixes opening and closing trades.
- Market makers. Liquidity programs reward resting orders, which makes the maker side more professional and the taker side more varied.
Worked example
A trader sends an order to buy 100 Yes at the ask of 7¢ on a long-shot outcome. It fills against a maker’s resting offer. The trade appears in the feed as Yes price $0.07, No price $0.93, 100 contracts, taker positioned Yes. In the table above it counts in the “under 10¢” row as a Yes trade. If the trader later sells those 100 Yes at 12¢ into a bid, that second trade counts as a No taker paying 88¢.
For outcome accuracy rather than order flow, see the accuracy scorecard; for trading costs, the trading-costs page.
Download the data
Taker flow totals by price paid and category (CSV)
Totals by price paid and by category; no individual trades. Free to reuse under CC BY 4.0 with a link back to this page.
Embed this chart
Methodology
- Data. Kalshi public /markets/trades endpoint, field taker_outcome_side (the outcome the taker is positioned for).
- Sample. For each hour since Oct 16, 2026, the 2,000 most recent trades before the top of the hour. 644 hourly samples so far; each daily update adds the latest day.
- Excluded. Combination markets (KXMVE) and block trades.
- Stored. Aggregated counts only; no trade-level or account data.
- Limits. A sample, not every trade: for each hour, the up-to-2,000 most recent trades before the top of the hour (busy hours are sampled for a few minutes, quiet hours more fully). Combination (multivariate) and block trades are excluded. Window: Oct 16, 2026 to Nov 12, 2026. Nothing here is investment advice. Last run: Nov 12, 2026, 8:02 AM ET.
Cite this research
Suggested citation: PredictionScout. (2026, November 12). Which Side Kalshi Traders Take: Yes vs No Taker Flow. https://predictionscout.com/research/kalshi-taker-flow-yes-vs-no/
For a chart or news story: “Source: PredictionScout analysis of public exchange data (https://predictionscout.com/research/kalshi-taker-flow-yes-vs-no/)”
The data and charts on this page are free to reuse under CC BY 4.0 with a link back to this page. Trade data: Kalshi public API.
Data sources: prices and volumes come from the public APIs of Kalshi and Polymarket. All trademarks belong to their owners. PredictionScout is independent and not affiliated with any exchange. Nothing here is investment, betting, or legal advice.
Related: Accuracy scorecard · Trading costs · All research