2.1%
U.S. nonfarm business productivity was 2.1% higher in 2026 Q3 than a year earlier, according to BLS. Real average hourly earnings changed -0.5% from a year earlier in Sep 2026. Kalshi has markets on whether productivity growth tops 3% in any 2026 quarter and whether real wages are up from a year earlier in December.
Kalshi market data and U.S. Bureau of Labor Statistics, pulled Nov 12, 2026, 8:03 AM ET. Updated daily.
By Arthur Angelo, PredictionScout Research · Updated Nov 12, 2026, 8:03 AM ET
Key findings
- Productivity: 2.1% from a year earlier in 2026 Q3.
- Real average hourly earnings: -0.5% in Sep 2026.
The markets
| Market | Closes | Market middle | Contracts (chance) | Latest BLS figure | Contracts traded |
|---|---|---|---|---|---|
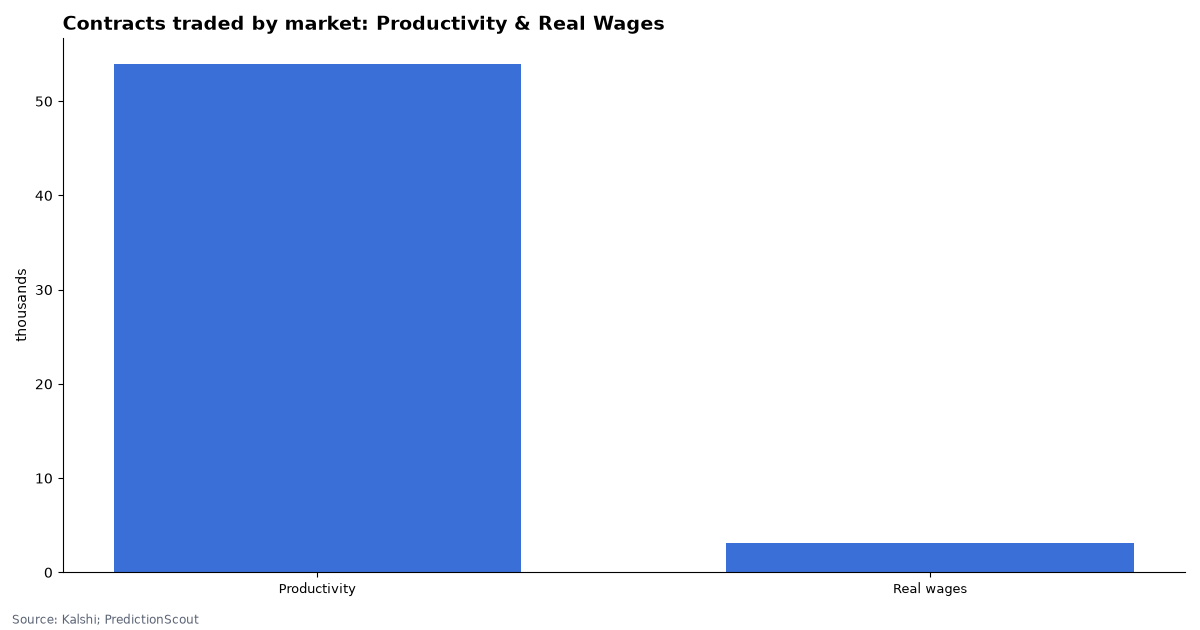
| Nonfarm productivity growth above level in any 2026 quarter (YoY) | 2027-03-04 | single contract: 34% chance above 3% | >3%: 34% | 2.1% in 2026 Q3; 2026 high so far 2.8% (Q1) | 53,977 |
| Real average hourly earnings, Dec 2026 YoY | 2027-01-13 | single contract: 91% chance above 0% | >0%: 91% | -0.5% in 2026 M09 (thinly traded market) | 3,060 |
Market middle: for “above X” ladders, the point where the implied chance crosses 50% (prices forced to fall as the threshold rises, interpolated between rungs). Prices are the bid/ask midpoint when the spread is 10¢ or less, otherwise the last trade. Events with fewer than 500 contracts traded show “thin trading” instead of a middle, and ladders whose quoted prices contradict each other show “prices out of order”. Pulled Nov 12, 2026, 8:03 AM ET.
BLS data
| Quarter | Productivity, change from a year earlier |
|---|---|
| 2026 Q3 | 2.1% |
| 2026 Q2 | 2.3% |
| 2026 Q1 | 2.8% |
| 2025 Q4 | 2.4% |
| 2025 Q3 | 2.7% |
| 2025 Q2 | 2.4% |
| Month | Real average hourly earnings, change from a year earlier |
|---|---|
| Sep 2026 | -0.5% |
| Aug 2026 | -0.3% |
| Jul 2026 | -0.1% |
| Jun 2026 | -0.1% |
| May 2026 | -0.8% |
| Apr 2026 | -0.3% |
How they settle
Productivity: output per hour worked in the nonfarm business sector, from the BLS Productivity and Costs release. The market asks whether the change from the same quarter a year earlier tops the level in any quarter of 2026. Each quarter appears first as a preliminary estimate about five weeks after the quarter ends and is revised a month later; the fourth-quarter figure arrives in early 2027. Real wages: average hourly earnings of all private-sector employees adjusted for inflation with the CPI-U, seasonally adjusted, from the BLS Real Earnings release for December 2026 (published in January 2027).
What moves it
Productivity rises when output grows faster than hours: strong GDP with slow hiring lifts it, and a recession with few layoffs pulls it down. GDP revisions feed straight into revised productivity. Real wages are nominal wage growth minus CPI inflation, so a jump in prices (from energy or tariffs) can turn them negative even if pay rises steadily.
Worked example
Real wage growth is roughly nominal wage growth minus inflation. If average hourly earnings are up 3.6% from a year earlier and the CPI is up 3.1%, real earnings are up about 0.5%, and the “above 0.0%” contract pays. If inflation climbs to 3.8% with the same pay growth, real earnings fall about 0.2% and it does not. For productivity, the market pays if any of the four 2026 quarters, as published at settlement, comes in above 3%; the best quarter so far is 2.8%.
Download the data
Productivity & Real Wages markets (one row per event) (CSV)
One row per live event: market middle, contracts listed and traded, and the latest official value. No contract prices or price histories. Free to reuse under CC BY 4.0 with a link back to this page.
Embed this chart
Methodology
- Markets. Open Kalshi events for each series, read from the public API. Prices are bid/ask midpoints when the spread is 10¢ or less, otherwise the last trade.
- Official values. BLS Public Data API: PRS85006093 (nonfarm business labor productivity index, quarterly) and CES0500000013 (real average hourly earnings, private employees, 1982-84 dollars, seasonally adjusted); changes from a year earlier computed from index levels.
- No prices in the CSV. One row per event: market middle, contracts listed and traded, and the latest official value.
- Limits. The real-wage market is thinly traded, so its price may not reflect much information. Market middles are snapshots, not forecasts we endorse. Nothing here is investment advice. Last run: Nov 12, 2026, 8:03 AM ET.
Cite this research
Suggested citation: PredictionScout. (2026, November 12). Productivity and Real Wage Prediction Markets vs BLS Data. https://predictionscout.com/research/productivity-real-wages-prediction-markets/
For a chart or news story: “Source: PredictionScout analysis of public exchange data (https://predictionscout.com/research/productivity-real-wages-prediction-markets/)”
The data and charts on this page are free to reuse under CC BY 4.0 with a link back to this page. Market data: Kalshi. Official data: U.S. Bureau of Labor Statistics.
Data sources: prices and volumes come from the public APIs of Kalshi and Polymarket. All trademarks belong to their owners. PredictionScout is independent and not affiliated with any exchange. Nothing here is investment, betting, or legal advice.
Related: Jobs report markets · CPI markets · All research