$40.56T
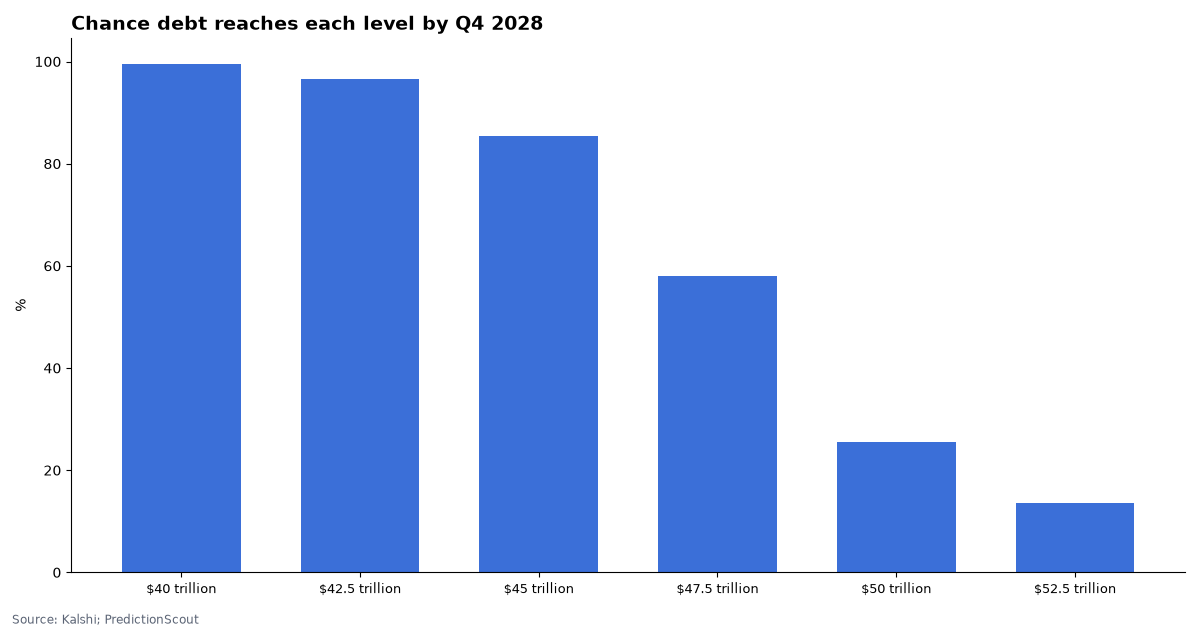
Total public debt was $40,559,796,589,243.37 on 2026-11-09, according to the Treasury, up $2.44 trillion in a year. At that pace it would reach about $45.8 trillion by the end of 2028. Kalshi asks which levels the debt will reach in any quarter through the fourth quarter of 2028.
Kalshi market data and U.S. Treasury (Fiscal Data); FRED, pulled Nov 12, 2026, 8:04 AM ET. Updated daily.
By Arthur Angelo, PredictionScout Research · Updated Nov 12, 2026, 8:04 AM ET
Key findings
- Debt to the Penny: $40.56 trillion on 2026-11-09; growth over the past year $2.44 trillion.
- Market: >40: 100% · >42.5: 97% · >45: 86% · >47.5: 58% · >50: 26% · >52.5: 14%.
The market
Each row pays $1 if the debt reaches that level in any quarter from Q4 2024 through Q4 2028.
| Debt level | Chance | Contracts traded |
|---|---|---|
| $40 trillion | 100% | 62,674 |
| $42.5 trillion | 97% | 1,852 |
| $45 trillion | 86% | 18,610 |
| $47.5 trillion | 58% | 3,777 |
| $50 trillion | 26% | 31,767 |
| $52.5 trillion | 14% | 2,443 |
Market middle: for “above X” ladders, the point where the implied chance crosses 50% (prices forced to fall as the threshold rises, interpolated between rungs). Prices are the bid/ask midpoint when the spread is 10¢ or less, otherwise the last trade. Events with fewer than 500 contracts traded show “thin trading” instead of a middle, and ladders whose quoted prices contradict each other show “prices out of order”. Pulled Nov 12, 2026, 8:04 AM ET.
Treasury data
| Series | Date | Value |
|---|---|---|
| Debt to the Penny (daily) | 2026-11-09 | $40.560 trillion |
| Debt to the Penny, a year earlier | 2025-11-07 | $38.117 trillion |
| GFDEBTN (quarterly) | 2026-04-01 | $39.462 trillion |
| GFDEBTN (quarterly) | 2026-01-01 | $39.065 trillion |
| GFDEBTN (quarterly) | 2025-10-01 | $38.514 trillion |
| GFDEBTN (quarterly) | 2025-07-01 | $37.638 trillion |
How it settles
The market uses GFDEBTN, “Federal Debt: Total Public Debt”, a quarterly series the St. Louis Fed publishes from Treasury data. Each quarter’s value is the debt on the last day of that quarter, so a level touched mid-quarter and then paid down would not count. Total public debt includes debt held by the public and intragovernmental holdings (such as the Social Security trust funds). The daily Debt to the Penny figure is the same measure and the best real-time guide.
What moves it
The annual deficit drives most of the growth: spending above tax revenue, plus interest on existing debt. Trust-fund surpluses add to intragovernmental debt. A debt-limit standoff can freeze the total for months, after which it jumps once the limit is raised or suspended. Recessions raise deficits; tax and tariff revenue changes lower or raise them.
Worked example
The debt grew $2.44 trillion in the year to 2026-11-09. If it keeps that pace, it would end 2028 at about $45.8 trillion, so a level below that is likely to be reached and a level well above it would need faster borrowing. A debt-limit freeze in 2027 or 2028 could push the crossing past the last quarter that counts.
Download the data
National Debt markets (one row per event) (CSV)
One row per live event: market middle, contracts listed and traded, and the latest official value. No contract prices or price histories. Free to reuse under CC BY 4.0 with a link back to this page.
Embed this chart
Methodology
- Markets. Open Kalshi events for each series, read from the public API. Prices are bid/ask midpoints when the spread is 10¢ or less, otherwise the last trade.
- Official values. Treasury Fiscal Data API, Debt to the Penny (tot_pub_debt_out_amt), and FRED series GFDEBTN, pulled on the run date.
- No prices in the CSV. One row per event: market middle, contracts listed and traded, and the latest official value.
- Limits. Market middles are snapshots, not forecasts we endorse. Official values shown are the latest published, not necessarily the period each market settles on. Thinly traded events are flagged. Nothing here is investment advice. Last run: Nov 12, 2026, 8:04 AM ET.
Cite this research
Suggested citation: PredictionScout. (2026, November 12). National Debt Prediction Markets vs Treasury Data. https://predictionscout.com/research/national-debt-prediction-markets/
For a chart or news story: “Source: PredictionScout analysis of public exchange data (https://predictionscout.com/research/national-debt-prediction-markets/)”
The data and charts on this page are free to reuse under CC BY 4.0 with a link back to this page. Market data: Kalshi. Official data: U.S. Treasury (Fiscal Data); FRED.
Data sources: prices and volumes come from the public APIs of Kalshi and Polymarket. All trademarks belong to their owners. PredictionScout is independent and not affiliated with any exchange. Nothing here is investment, betting, or legal advice.
Related: Government shutdown markets · All research