153 bu/acre
USDA’s latest forecast (November 10, 2026) puts South Dakota’s 2026 corn yield at 153.0 bushels an acre, up from 151.0 a month earlier but well below the record 171.0 set in 2025. Kalshi’s market crosses 50% at 152.128 bu/acre.
Kalshi market data and USDA National Agricultural Statistics Service, pulled Nov 12, 2026, 8:04 AM ET. Updated daily.
By Arthur Angelo, PredictionScout Research · Updated Nov 12, 2026, 8:04 AM ET
Key findings
- USDA forecast (November 10, 2026): 153.0 bu/acre, versus 151.0 last month and 171.0 in 2025.
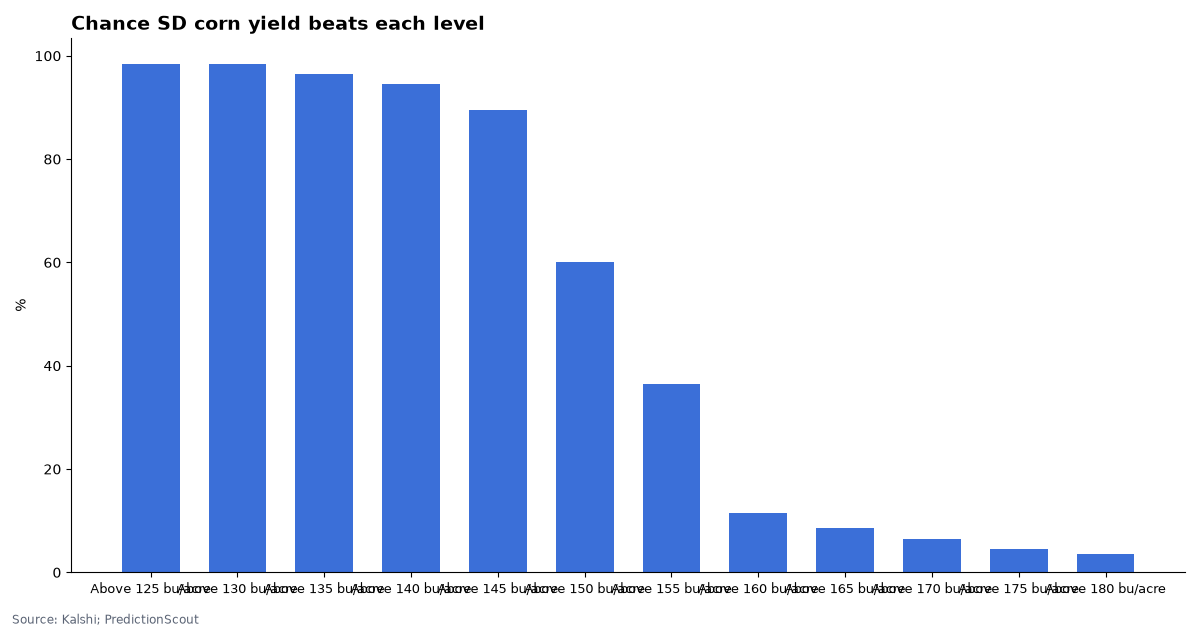
- Market: >135: 96% · >140: 94% · >145: 90% · >150: 60% · >155: 36% · >160: 12% · >165: 8%.
The market
Each row pays $1 if the final 2026 yield is above that level.
| Final 2026 yield | Chance | Contracts traded |
|---|---|---|
| Above 125 bu/acre | 98% | 68,617 |
| Above 130 bu/acre | 98% | 63,071 |
| Above 135 bu/acre | 96% | 16,114 |
| Above 140 bu/acre | 94% | 7,796 |
| Above 145 bu/acre | 90% | 35,755 |
| Above 150 bu/acre | 60% | 21,352 |
| Above 155 bu/acre | 36% | 32,759 |
| Above 160 bu/acre | 12% | 60,550 |
| Above 165 bu/acre | 8% | 49,222 |
| Above 170 bu/acre | 6% | 75,244 |
| Above 175 bu/acre | 4% | 45,273 |
| Above 180 bu/acre | 4% | 50,209 |
Market middle: for “above X” ladders, the point where the implied chance crosses 50% (prices forced to fall as the threshold rises, interpolated between rungs). Prices are the bid/ask midpoint when the spread is 10¢ or less, otherwise the last trade. Events with fewer than 500 contracts traded show “thin trading” instead of a middle, and ladders whose quoted prices contradict each other show “prices out of order”. Pulled Nov 12, 2026, 8:04 AM ET.
What USDA says
| Measure | 2025 | 2026 |
|---|---|---|
| Yield, bu/acre (latest forecast) | 171.0 | 153.0 |
| Previous month’s forecast | 151.0 | |
| Area harvested, thousand acres | 5,840 | |
| Production, thousand bushels | 1,085,850 | 893,520 |
How it settles
The market settles on the final 2026 corn-for-grain yield for South Dakota in USDA NASS’s Crop Production Annual Summary, released in January 2027. The monthly Crop Production reports (August to November) are forecasts; the annual summary replaces them with a figure based on farmer surveys after harvest. Yield is bushels harvested divided by acres harvested for grain, so acres cut for silage or abandoned are not in the denominator.
What moves it
Monthly forecasts change as NASS gets more field counts (ears per acre, ear weight) and farmer reports. In South Dakota, late-summer drought and early frost are the big risks; harvest progress in the weekly Crop Progress report shows when real yields start coming in. Large swings between the September forecast and the final figure are common in dry years.
Worked example
Suppose the “above 150” contract trades at 55 cents while USDA’s forecast is 153.0. A buyer is betting the final number holds above 150, a cushion of +3.0 bushels. If November’s report trims the forecast to 148, that contract would likely fall, even though the market still settles only in January. For scale, each bushel of yield across 5,840 thousand acres is about 5.8 million bushels of production.
Download the data
South Dakota Corn Yield markets (one row per event) (CSV)
One row per live event: market middle, contracts listed and traded, and the latest official value. No contract prices or price histories. Free to reuse under CC BY 4.0 with a link back to this page.
Embed this chart
Methodology
- Markets. Open Kalshi events for each series, read from the public API. Prices are bid/ask midpoints when the spread is 10¢ or less, otherwise the last trade.
- Official values. USDA NASS Crop Production report released November 10, 2026 (ESMIS text file), corn for grain by state.
- No prices in the CSV. One row per event: market middle, contracts listed and traded, and the latest official value.
- Limits. Market middles are snapshots, not forecasts we endorse. Official values shown are the latest published, not necessarily the period each market settles on. Thinly traded events are flagged. Nothing here is investment advice. Last run: Nov 12, 2026, 8:04 AM ET.
Cite this research
Suggested citation: PredictionScout. (2026, November 12). South Dakota Corn Yield Prediction Markets vs USDA Forecasts. https://predictionscout.com/research/south-dakota-corn-yield-prediction-markets/
For a chart or news story: “Source: PredictionScout analysis of public exchange data (https://predictionscout.com/research/south-dakota-corn-yield-prediction-markets/)”
The data and charts on this page are free to reuse under CC BY 4.0 with a link back to this page. Market data: Kalshi. Official data: USDA National Agricultural Statistics Service.
Data sources: prices and volumes come from the public APIs of Kalshi and Polymarket. All trademarks belong to their owners. PredictionScout is independent and not affiliated with any exchange. Nothing here is investment, betting, or legal advice.
Related: Food price markets · All research