4.23M
New York City’s subway has averaged 4,234,637 riders a weekday in November 2026 so far (6 weekdays of MTA data through 2026-11-09).
Kalshi market data and MTA (data.ny.gov), U.S. Census Bureau, pulled Nov 12, 2026, 8:05 AM ET. Updated daily.
By Arthur Angelo, PredictionScout Research · Updated Nov 12, 2026, 8:05 AM ET
Key findings
- MTA data: 4,234,637 average weekday riders in November 2026 so far (6 weekdays).
- NYC population change, July 2025 to July 2027: most likely: Increase 0.01-0.99%.
Subway ridership markets
Kalshi asks whether the average weekday subway ridership for a month will be above a set number. Our table shows the live ladder next to what MTA data show so far.
| Market | Closes | Market middle | Contracts (chance) | Latest official figure | Contracts traded |
|---|---|---|---|---|---|
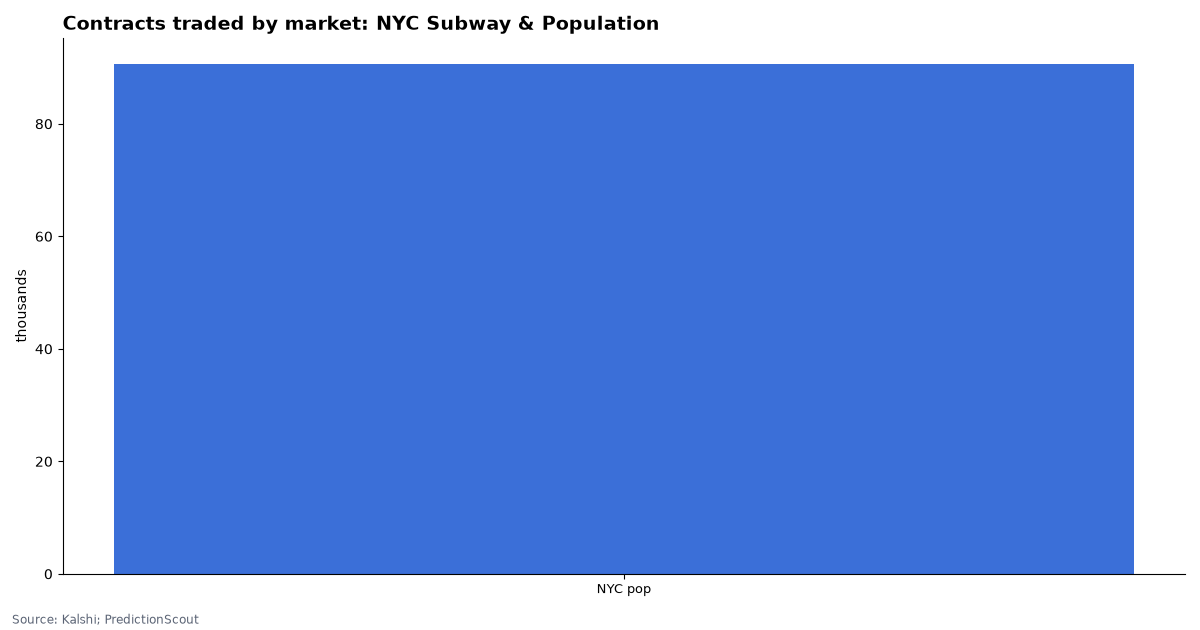
| NYC population change, July 2025 to July 2027 | 2028-06-01 | most likely: Increase 0.01-0.99% | Increase 0.01-0.99%: 40% · No change or decrease 0–0.99%: 36% · Decrease 1-1.99%: 7% · Increase 1-1.99%: 4% · Increase 3% or more: 3% | 8,584,629 (July 1, 2025 estimate; −0.14% from 2024) | 90,713 |
Market middle: for “above X” ladders, the point where the implied chance crosses 50% (prices forced to fall as the threshold rises, interpolated between rungs). Prices are the bid/ask midpoint when the spread is 10¢ or less, otherwise the last trade. Events with fewer than 500 contracts traded show “thin trading” instead of a middle, and ladders whose quoted prices contradict each other show “prices out of order”. Pulled Nov 12, 2026, 8:05 AM ET.
How the subway market settles
The figure is the mean of the MTA’s daily subway ridership for every Monday through Friday in the month, holidays included, as published in the MTA’s Daily Ridership and Traffic series (the same numbers on data.ny.gov). Ridership counts entries: each swipe or tap at a turnstile; fare evasion is not counted. The MTA can revise recent days, and the market uses the figures as published when it settles, about ten days after month-end.
What moves it
Weather (heavy rain and cold cut trips), holidays falling on weekdays (Columbus Day in October, Thanksgiving in November), school calendars, return-to-office patterns (Tuesdays to Thursdays are busiest), service disruptions and fare changes. Congestion pricing in Manhattan, which started on Jan. 5, 2025, has also nudged some drivers onto transit.
Worked example
Holidays matter: a weekday holiday with 2.5 million riders instead of 4.5 million drags a 22-weekday average down by about 90,000 on its own, since it counts in the denominator like any other weekday.
NYC population market
A second market asks how much New York City’s population will change between the Census Bureau’s July 1, 2025 and July 1, 2027 estimates, in percentage buckets. The Bureau’s Vintage 2025 estimates put the city at 8,584,629 on July 1, 2025, down from 8,596,825 a year earlier (−0.14%) and from 8,805,594 in the April 2020 base. Settlement uses the Vintage 2027 release (around May 2027 for cities), which also revises earlier years, so the 2025 starting figure can change. Immigration is the swing factor: the city loses residents to the rest of the country each year, and international arrivals decide whether the total rises or falls.
Download the data
NYC Subway & Population markets (one row per event) (CSV)
One row per live event: market middle, contracts listed and traded, and the latest official value. No contract prices or price histories. Free to reuse under CC BY 4.0 with a link back to this page.
Embed this chart
Methodology
- Markets. Open Kalshi events for each series, read from the public API. Prices are bid/ask midpoints when the spread is 10¢ or less, otherwise the last trade.
- Official values. MTA Daily Ridership Data on data.ny.gov (dataset sayj-mze2, mode = Subway), pulled on the run date; Census Bureau Vintage 2025 city population estimates (sub-est2025).
- No prices in the CSV. One row per event: market middle, contracts listed and traded, and the latest official value.
- Limits. Market middles are snapshots, not forecasts we endorse. Official values shown are the latest published, not necessarily the period each market settles on. Thinly traded events are flagged. Nothing here is investment advice. Last run: Nov 12, 2026, 8:05 AM ET.
Cite this research
Suggested citation: PredictionScout. (2026, November 12). NYC Subway Ridership Prediction Markets vs MTA Data. https://predictionscout.com/research/nyc-subway-ridership-prediction-markets/
For a chart or news story: “Source: PredictionScout analysis of public exchange data (https://predictionscout.com/research/nyc-subway-ridership-prediction-markets/)”
The data and charts on this page are free to reuse under CC BY 4.0 with a link back to this page. Market data: Kalshi. Official data: MTA (data.ny.gov), U.S. Census Bureau.
Data sources: prices and volumes come from the public APIs of Kalshi and Polymarket. All trademarks belong to their owners. PredictionScout is independent and not affiliated with any exchange. Nothing here is investment, betting, or legal advice.
Related: Tourism markets · All research