13 markets
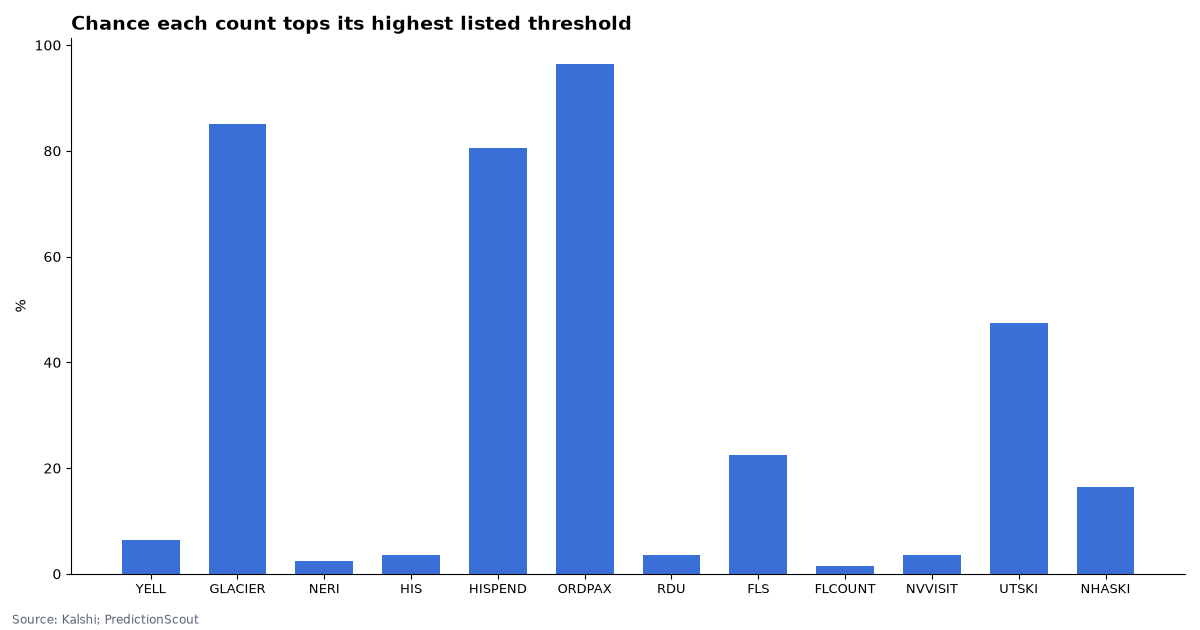
Kalshi lists 13 live markets on how many people visit a park, a state, an airport or the ski slopes, each settling on the count one named agency or trade group publishes. Yellowstone, which had 4,762,988 recreation visits in 2025, is priced at 6% to top 5M in 2026.
Kalshi market data and the National Park Service, pulled Oct 23, 2026, 11:10 AM ET. Updated daily.
By Arthur Angelo, PredictionScout Research · Updated Oct 23, 2026, 11:10 AM ET
Key findings
- Yellowstone recreation visits, 2026: single contract: 6% chance above 5M; settles on National Park Service.
- Glacier recreation visits, 2026: single contract: 85% chance above 3.31M; settles on National Park Service.
- New River Gorge recreation visits, 2026: 2.05M; settles on National Park Service.
- Hawaii visitor arrivals (millions): 9.68M; settles on Hawaii DBEDT.
- Hawaii visitor spending, 2026 ($ billions): single contract: 80% chance above $21.7531B; settles on Hawaii DBEDT.
The markets today
One row per count, using the nearest live event. “Market middle” is where the implied chance of “above X” crosses 50%; many of these are a single yes-or-no threshold.
| Count | Closes | Market middle | Contracts (chance) | Latest official figure | Contracts traded |
|---|---|---|---|---|---|
| Yellowstone recreation visits, 2026 | 2027-03-31 | single contract: 6% chance above 5M | >5M: 6% | 2025 final: 4,762,988 (NPS) | 48,723 |
| Glacier recreation visits, 2026 | 2027-03-12 | single contract: 85% chance above 3.31M | >3.31M: 85% | 2025 final: 3,136,557 (NPS) | 11,259 |
| New River Gorge recreation visits, 2026 | 2027-03-31 | 2.05M | >1.9M: 92% · >2M: 70% · >2.1M: 30% · >2.2M: 14% · >2.3M: 8% | 2025 final: 1,958,440 (NPS) | 116,522 |
| Hawaii visitor arrivals (millions) | 2027-01-31 | 9.68M | >9.4M: 98% · >9.6M: 72% · >9.8M: 16% · >10M: 6% · >10.2M: 4% | settles on Hawaii DBEDT | 40,256 |
| Hawaii visitor spending, 2026 ($ billions) | 2027-01-29 | single contract: 80% chance above $21.7531B | >$21.7531B: 80% | settles on Hawaii DBEDT | 23,717 |
| O’Hare passengers, 2026 | 2027-04-30 | single contract: 96% chance above 84.86M | >84.86M: 96% | settles on Chicago Department of Aviation | 12,228 |
| Raleigh-Durham passengers, 2026 (millions) | 2027-02-28 | 15.87M | >15.5M: 94% · >15.75M: 82% · >16M: 12% · >16.25M: 8% · >16.5M: 4% | settles on Raleigh-Durham Airport Authority | 93,253 |
| Florida visitors, 2026 (millions) | 2027-02-26 | single contract: 22% chance above 143.33M | >143.33M: 22% | settles on VISIT FLORIDA | 69,723 |
| Florida visitors, 2026 (second market, millions) | 2027-02-26 | 141.4M | >138M: 94% · >140M: 80% · >142M: 38% · >144M: 15% · >146M: 2% | settles on VISIT FLORIDA | 215,456 |
| Nevada visitor volume, 2026 (millions) | 2027-06-30 | 49.88M | >48M: 94% · >49M: 90% · >50M: 44% · >51M: 8% · >52M: 6% | settles on Travel Nevada | 78,321 |
| Utah skier visits, 2026–27 | 2027-07-31 | single contract: 48% chance above 6M | >6M: 48% | settles on Ski Utah | 13,749 |
| Colorado skier visits, 2026–27 (millions) | 2027-06-18 | thin trading | >10.5M: 92% | settles on Colorado Ski Country USA | 156 |
| New Hampshire alpine skier visits, 2026–27 | 2027-06-30 | single contract: 16% chance above 2.28M | >2.28M: 16% | settles on Ski New Hampshire | 14,892 |
Market middle: for “above X” ladders, the point where the implied chance crosses 50% (prices forced to fall as the threshold rises, interpolated between rungs). Prices are the bid/ask midpoint when the spread is 10¢ or less, otherwise the last trade. Events with fewer than 500 contracts traded show “thin trading” instead of a middle, and ladders whose quoted prices contradict each other show “prices out of order”. Pulled Oct 23, 2026, 11:10 AM ET.
Who publishes each count, and how it settles
- National parks. The final calendar-year “recreation visits” in the National Park Service’s Visitor Use Statistics. NPS counts vehicles at entrances and multiplies by a park-specific persons-per-vehicle factor. Monthly and year-to-date figures are preliminary; NPS finalizes the year by the end of March, and only that final total counts.
- Hawaii. Total visitor arrivals and visitor spending for the calendar year as reported by the state Department of Business, Economic Development and Tourism (DBEDT), which surveys arriving air and cruise passengers.
- Airports. Calendar-year total passengers (enplaned plus deplaned) reported by the Chicago Department of Aviation for O’Hare and by the Raleigh-Durham Airport Authority for RDU.
- Florida and Nevada. VISIT FLORIDA’s annual visitor estimate and Travel Nevada’s statewide visitor volume. Both are modeled estimates, not turnstile counts, and both have been revised in the past.
- Skier visits. Season totals (one person skiing one day is one visit) from Ski Utah, Colorado Ski Country USA and Ski New Hampshire, typically released in the spring after the season ends. Colorado Ski Country covers its member resorts’ statewide total as it reports it.
What moves them. Weather (snowfall for ski seasons, wildfire smoke and road closures for parks), airline capacity, exchange rates for international travelers, and one-off events such as construction closures inside a park.
Worked example: Yellowstone
Yellowstone had 4,762,988 recreation visits in 2025. To clear the market’s 5M threshold, 2026 would need 5.0% more visits. NPS publishes a preliminary December total in January, but the market waits for the final number around the end of March; if the preliminary count is just above the threshold and the final one is just below, the contract resolves No.
Download the data
Tourism and visitor-count markets (one row per event) (CSV)
One row per live event: market middle, contracts listed and traded, and the 2025 NPS count where available. No contract prices. Free to reuse under CC BY 4.0 with a link back to this page.
Embed this chart
Methodology
- Markets. Open Kalshi events for each series, nearest close first, from the public API. Political-trip markets that use the word “visit” are excluded.
- Official values. Final 2025 recreation visits from the NPS Visitor Use Statistics (IRMA) service for the three parks. The other publishers’ 2025 totals were not available in a machine-readable primary source, so the table names the publisher instead.
- No prices in the CSV. One row per event.
- Limits. Only the national parks have a primary-source 2025 comparison here. State and trade-group estimates use their own methods and can be revised before the markets settle. Nothing here is investment advice. Last run: Oct 23, 2026, 11:10 AM ET.
Cite this research
Suggested citation: PredictionScout. (2026, October 23). Tourism Prediction Markets: National Park, Airport and Skier Visits. https://predictionscout.com/research/tourism-visits-prediction-markets/
For a chart or news story: “Source: PredictionScout analysis of public exchange data (https://predictionscout.com/research/tourism-visits-prediction-markets/)”
The data and charts on this page are free to reuse under CC BY 4.0 with a link back to this page. Market data: Kalshi. Official data: National Park Service Visitor Use Statistics.
Data sources: prices and volumes come from the public APIs of Kalshi and Polymarket, with 2025 counts from NPS Visitor Use Statistics. All trademarks belong to their owners. PredictionScout is independent and not affiliated with any exchange. Nothing here is investment, betting, or legal advice.
Related: Travel advisory markets · All research