18 markets
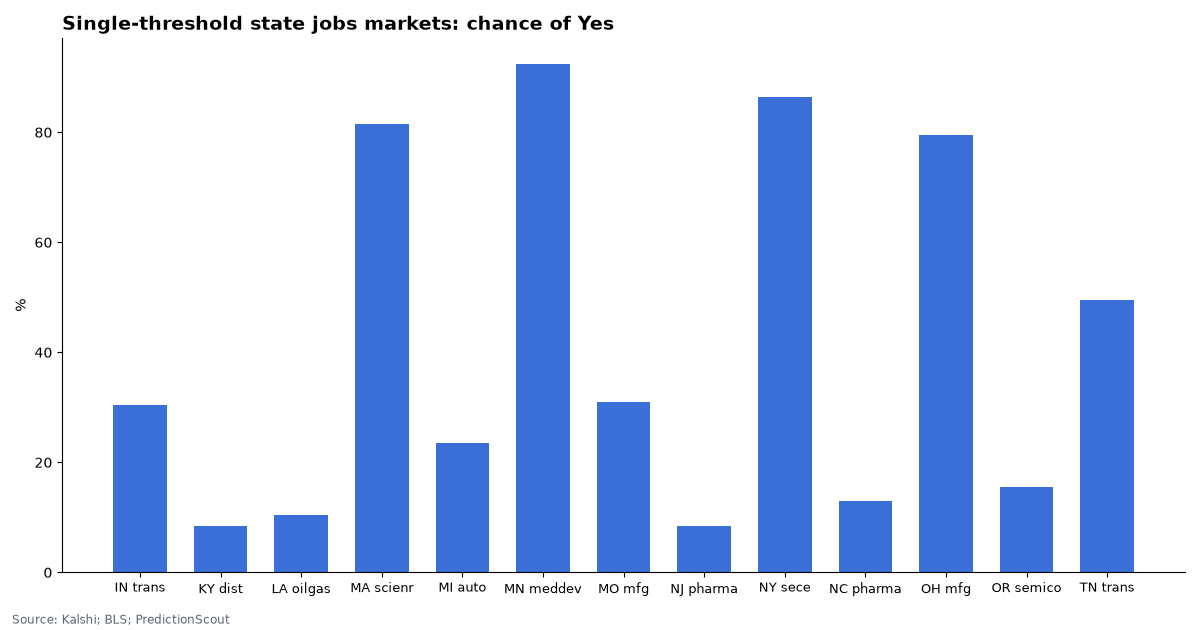
Kalshi lists 18 live markets on employment in a single industry in a single state, almost all settling on Bureau of Labor Statistics state payroll (CES) data. 13 of them are a single yes-or-no contract, usually on whether 2026 beats the 2025 level; traders put that at under 50% in 9 of the 13.
Kalshi market data and BLS, pulled Oct 23, 2026, 11:09 AM ET. Updated daily.
By Arthur Angelo, PredictionScout Research · Updated Oct 23, 2026, 11:09 AM ET
Key findings
- Wisconsin manufacturing: market middle 455,855, +0.0% from the latest official average.
- Pennsylvania manufacturing: market middle 556,756, +0.1% from the latest official average.
- Washington aerospace products and parts: market middle 84,337, +0.8% from the latest official average.
- 18 state-industry markets are live; 1 have fewer than 500 contracts traded.
The markets today
One row per state and industry, using the nearest live event. Thresholds are in thousands of jobs (Kentucky distilleries is in jobs). “Market middle” is where the implied chance of “above X” crosses 50%. The official column shows the matching BLS series’ 2025 average and its 2026 average so far, or December 2025 for markets settling on a December figure.
| State and industry | Closes | Market middle | Contracts (chance) | Latest official figure | Contracts traded |
|---|---|---|---|---|---|
| Indiana transportation equipment | 2027-03-31 | single contract: 30% chance above 120,800 | >120,800: 30% | 2025 avg: 121.6k; 2026 avg so far (9 mo.): 119.8k | 9,610 |
| Kentucky distilleries (QCEW, June 2026) | 2026-12-02 | single contract: 8% chance above 7,542 | >7,542: 8% | threshold set at the June 2025 QCEW count (per Kalshi rules) | 30,465 |
| Louisiana oil and gas extraction | 2027-04-30 | single contract: 11% chance above 5,100 | >5,100: 11% | 2025 avg: 5.1k; 2026 avg so far (9 mo.): 4.9k | 1,856 |
| Massachusetts scientific R&D services | 2027-04-30 | single contract: 82% chance above 103,400 | >103,400: 82% | 2025 avg: 103.4k; 2026 avg so far (9 mo.): 103.9k | 22,960 |
| Michigan motor vehicles and parts | 2027-04-30 | single contract: 24% chance above 156,600 | >156,600: 24% | 2025 avg: 156.5k; 2026 avg so far (9 mo.): 155.1k | 21,095 |
| Minnesota medical equipment and supplies | 2027-04-30 | single contract: 92% chance above 18,200 | >18,200: 92% | 2025 avg: 18.2k; 2026 avg so far (9 mo.): 18.8k | 15,348 |
| Missouri manufacturing | 2027-04-30 | single contract: 31% chance above 280,500 | >280,500: 31% | 2025 avg: 280.5k; 2026 avg so far (9 mo.): 278.5k | 48,323 |
| New Jersey pharmaceutical and medicine | 2027-04-30 | single contract: 8% chance above 30,300 | >30,300: 8% | 2025 avg: 30.3k; 2026 avg so far (9 mo.): 29.4k | 13,433 |
| New York securities and commodity contracts | 2027-04-30 | single contract: 86% chance above 230,400 | >230,400: 86% | 2025 avg: 230.4k; 2026 avg so far (9 mo.): 237.6k | 3,812 |
| North Carolina pharmaceutical and medicine | 2027-03-31 | single contract: 13% chance above 26,500 | >26,500: 13% | Dec. 2025: 26.5k; 2026 avg so far (9 mo.): 26.3k | 22,539 |
| Ohio manufacturing | 2027-04-30 | single contract: 80% chance above 677,400 | >677,400: 80% | 2025 avg: 677.4k; 2026 avg so far (9 mo.): 682.4k | 30,455 |
| Oregon semiconductors and components | 2027-03-31 | single contract: 16% chance above 26,400 | >26,400: 16% | 2025 avg: 28.3k; 2026 avg so far (9 mo.): 25.4k | 19,801 |
| Pennsylvania manufacturing | 2027-04-30 | 556,756 | >545,000: 96% · >550,000: 94% · >555,000: 73% · >560,000: 8% · >565,000: 6% | 2025 avg: 556.2k; 2026 avg so far (9 mo.): 556.4k | 181,819 |
| South Carolina transportation equipment | 2027-02-28 | thin trading | >53,600: 90% | Dec. 2025: 53.6k; 2026 avg so far (9 mo.): 55.0k | 293 |
| Tennessee transportation equipment | 2027-05-01 | single contract: 50% chance above 69,700 | >69,700: 50% | 2025 avg: 69.6k; 2026 avg so far (9 mo.): 69.7k | 17,938 |
| Washington aerospace products and parts | 2027-04-30 | 84,337 | >82,000: 96% · >83,000: 92% · >84,000: 66% · >85,000: 20% · >86,000: 8% | 2025 avg: 80.5k; 2026 avg so far (9 mo.): 83.7k | 636,720 |
| Washington tech (BLS series named in Kalshi rules) | 2027-02-28 | 258,878 | >250,000: 94% · >255,000: 77% · >260,000: 44% · >265,000: 8% · >270,000: 4% | — | 453,156 |
| Wisconsin manufacturing | 2027-04-30 | 455,855 | >450,000: 96% · >452,500: 94% · >455,000: 70% · >457,500: 12% · >460,000: 6% | 2025 avg: 458.2k; 2026 avg so far (9 mo.): 455.7k | 184,898 |
Market middle: for “above X” ladders, the point where the implied chance crosses 50% (prices forced to fall as the threshold rises, interpolated between rungs). Prices are the bid/ask midpoint when the spread is 10¢ or less, otherwise the last trade. Events with fewer than 500 contracts traded show “thin trading” instead of a middle, and ladders whose quoted prices contradict each other show “prices out of order”. Pulled Oct 23, 2026, 11:09 AM ET.
How these markets settle
Most contracts settle on the 2026 annual average BLS publishes for the named series in its state and metro (CES) data, usually in March, after the annual benchmark revision. The benchmark re-anchors a year of monthly estimates to unemployment-insurance tax records, and can move a state industry by a few percent. Kalshi uses the published annual average, not an average we compute, and later revisions do not count. A few (North Carolina pharma, South Carolina transportation equipment, Washington tech) settle on the first non-preliminary December 2026 value instead. Kentucky distilleries uses the BLS Quarterly Census of Employment and Wages (QCEW) count for June 2026, a near-census of employers, not a survey.
What moves them. Plant openings, closures and layoffs (one large employer can be several percent of a state industry), seasonal hiring (these series are not seasonally adjusted), and the benchmark revision. Small series, like Louisiana oil and gas extraction at about 5,000 jobs, swing more in percentage terms than large ones.
Worked example: Wisconsin manufacturing
BLS’s series SMU55000003000000001 shows 2025 avg: 458.2k; 2026 avg so far (9 mo.): 455.7k. The market middle is 455,855. Take the 2026 average so far, 455.7 thousand over nine months, and suppose October to December come in 1% lower: the 12-month average is (9 × 455.7 + 3 × 451.1) / 12 = 454.6 thousand. If the March benchmark then lowers every month by another 0.5%, the published average becomes about 452.3 thousand. A contract for “above 455,000” would resolve No on that path. That is why the benchmark matters as much as the monthly data.
Download the data
State industry employment markets (one row per event) (CSV)
One row per live event: market middle, contracts listed and traded, and the matching BLS figure. No contract prices. Free to reuse under CC BY 4.0 with a link back to this page.
Embed this chart
Methodology
- Markets. Open Kalshi events for each state-industry series, nearest close first, from the public API.
- Official values. BLS public API v2, the exact CES series named in each market’s rules (not seasonally adjusted). 2025 and 2026 averages are simple means of published months, shown for scale only; Michigan sums two series as the rules require.
- No prices in the CSV. One row per event.
- Limits. The 2026 average so far is not what settles; the benchmark-revised annual average is. Washington tech and Kentucky distilleries have no CES comparison here. Nothing here is investment advice. Last run: Oct 23, 2026, 11:09 AM ET.
Cite this research
Suggested citation: PredictionScout. (2026, October 23). State Industry Jobs Prediction Markets: Manufacturing, Pharma, Aerospace. https://predictionscout.com/research/state-industry-jobs-prediction-markets/
For a chart or news story: “Source: PredictionScout analysis of public exchange data (https://predictionscout.com/research/state-industry-jobs-prediction-markets/)”
The data and charts on this page are free to reuse under CC BY 4.0 with a link back to this page. Market data: Kalshi. Official data: Bureau of Labor Statistics, Current Employment Statistics (State and Metro Area).
Data sources: prices and volumes come from the public APIs of Kalshi and Polymarket, with official values from the BLS State and Metro Area Employment program. All trademarks belong to their owners. PredictionScout is independent and not affiliated with any exchange. Nothing here is investment, betting, or legal advice.
Related: Jobs report markets · Fed and macro indicator markets · All research