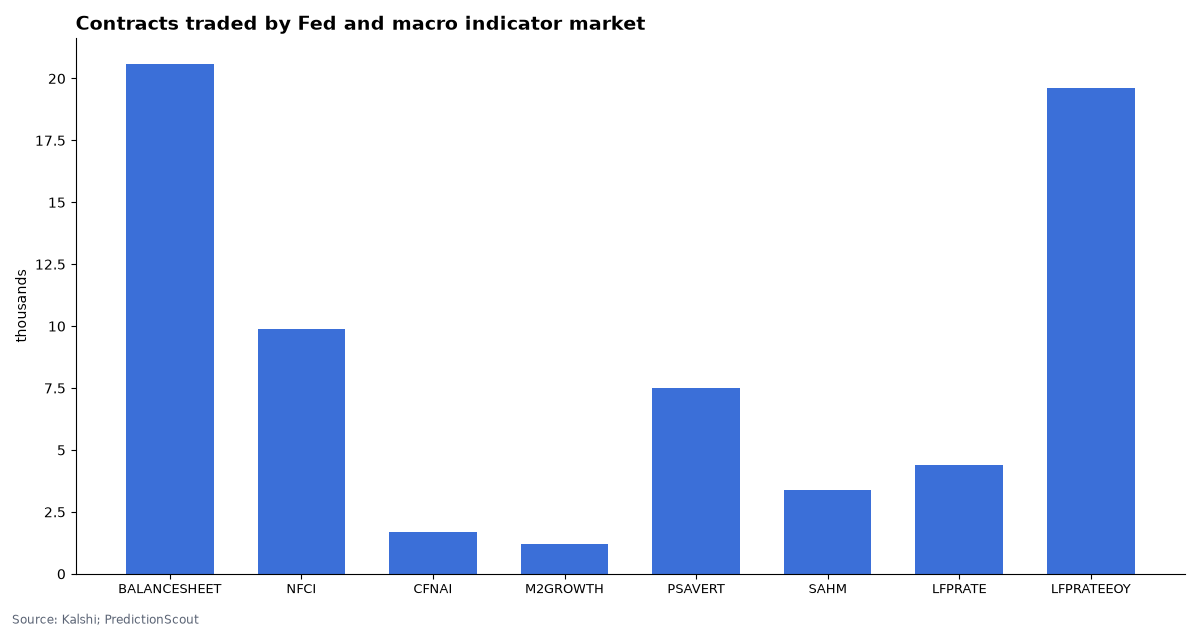
8 markets
Kalshi lists 8 live markets on Federal Reserve and macro indicators that settle on numbers the Fed, the Chicago Fed or FRED publish. The balance-sheet market’s middle for Dec. 30, 2026 is $6.79T, against $6.75T (2026-10-21) on the latest weekly H.4.1.
Kalshi market data and FRED, pulled Oct 23, 2026, 11:06 AM ET. Updated daily.
By Arthur Angelo, PredictionScout Research · Updated Oct 23, 2026, 11:06 AM ET
Key findings
- Fed balance sheet, total assets (trillions): market middle $6.79T; latest official $6.75T (2026-10-21).
- Chicago Fed NFCI (weekly): market middle above -0.5; latest official -0.496 (2026-10-16).
- Chicago Fed National Activity Index (monthly): market middle -0.002; latest official -0.04 (2026-08-01).
- M2 money supply, year-over-year growth: market middle most likely: 6.5% or Above; latest official 5.7% year over year (2026-08-01).
- Personal saving rate (December 2026): market middle most likely: 4.0% or Above; latest official 4.1% (2026-08-01).
- Real-time Sahm rule indicator: market middle single contract: 6% chance above 0.5; latest official 0.00 (2026-09-01).
The markets today
One row per indicator, using the nearest live event. For “above X” ladders, the market middle is where the implied chance crosses 50%; for bucket markets (M2, saving rate, one participation market) it is the bucket priced highest. The last-published official value is shown for scale; the market settles on a future print.
| Indicator | Closes | Market middle | Contracts (chance) | Latest official figure | Contracts traded |
|---|---|---|---|---|---|
| Fed balance sheet, total assets (trillions) | 2026-12-31 | $6.79T | >$6.60T: 91% · >$6.70T: 83% · >$6.80T: 45% · >$6.90T: 24% · >$7.00T: 21% | $6.75T (2026-10-21) | 20,611 |
| Chicago Fed NFCI (weekly) | 2026-10-28 | above -0.5 | >-0.58: 96% · >-0.56: 94% · >-0.54: 90% · >-0.52: 76% · >-0.5: 57% | -0.496 (2026-10-16) | 9,856 |
| Chicago Fed National Activity Index (monthly) | 2026-10-26 | -0.002 | >-0.2: 91% · >-0.1: 74% · >0: 50% · >0.1: 29% · >0.2: 15% | -0.04 (2026-08-01) | 1,685 |
| M2 money supply, year-over-year growth | 2027-01-26 | most likely: 6.5% or Above | 6.5% or Above: 24% · 5.5% to 5.9%: 21% · 6.0% to 6.4%: 20% · Below 5.0%: 18% · 5.0% to 5.4%: 18% | 5.7% year over year (2026-08-01) | 1,196 |
| Personal saving rate (December 2026) | 2027-01-29 | most likely: 4.0% or Above | 4.0% or Above: 35% · Below 2.5%: 21% · 3.0% to 3.4%: 16% · 2.5% to 2.9%: 16% · 3.5% to 3.9%: 12% | 4.1% (2026-08-01) | 7,492 |
| Real-time Sahm rule indicator | 2027-01-08 | single contract: 6% chance above 0.5 | >0.5: 6% | 0.00 (2026-09-01) | 3,367 |
| Labor-force participation rate (December 2026) | 2027-01-08 | most likely: 61.0% to 61.4% | 61.0% to 61.4%: 34% · 61.5% to 61.9%: 33% · 60.5% to 60.9%: 20% · Below 60.5%: 8% · 62.0% or Above: 6% | 61.8% (2026-09-01) | 4,370 |
| Labor-force participation rate, year-end | 2027-01-08 | 61.4% | >60.5%: 92% · >61.0%: 82% · >61.5%: 43% · >62.0%: 10% · >62.5%: 6% | 61.8% (2026-09-01) | 19,569 |
Market middle: for “above X” ladders, the point where the implied chance crosses 50% (prices forced to fall as the threshold rises, interpolated between rungs). Prices are the bid/ask midpoint when the spread is 10¢ or less, otherwise the last trade. Events with fewer than 500 contracts traded show “thin trading” instead of a middle, and ladders whose quoted prices contradict each other show “prices out of order”. Pulled Oct 23, 2026, 11:06 AM ET.
How each one settles
- Fed balance sheet. Total assets (Wednesday level) in the Fed’s H.4.1 release, the series FRED carries as WALCL, for the named week. It moves with quantitative tightening (letting Treasuries and mortgage securities run off), any reinvestment decisions by the FOMC, and emergency lending facilities.
- NFCI. The Chicago Fed’s weekly National Financial Conditions Index. Zero is average conditions since 1971; negative values mean looser than average, positive values tighter. It is built from 105 measures of risk, credit and leverage, and past weeks are revised each Wednesday, so the market uses the first release for the named week.
- CFNAI. A monthly weighted average of 85 activity indicators. Zero means the economy is growing at its historical trend; the market uses the headline index, not the three-month average, in the first release for the month.
- M2 growth. December 2026 M2SL divided by December 2025 M2SL, minus one, rounded to one decimal. Only the first FRED value counts.
- Personal saving rate. BEA’s December 2026 saving rate (FRED PSAVERT), first release. It is the share of disposable income not spent, and it is revised often.
- Sahm rule. FRED SAHMREALTIME: the three-month average unemployment rate minus its low over the prior 12 months. The rule “triggers” at 0.50 or more; a value of exactly 0.50 counts.
- Participation rate. The December 2026 civilian labor-force participation rate as shown by Trading Economics, with BLS / FRED CIVPART as the fallback. Aging pushes it down slowly; January population controls can shift it in a single month.
Worked example: the Sahm rule
Say the unemployment rate prints 4.3%, 4.4% and 4.6% in October, November and December. The three-month average is 4.43%. If the lowest three-month average in the previous 12 months was 4.10%, the indicator is 0.33: below 0.50, so a “will it trigger” contract resolves No for that month. One more 0.1-point rise in each month would lift the average to 4.53% and the indicator to 0.43, still short. That is why the Sahm contract usually needs several weak months in a row, not one bad report.
Worked example: M2 growth
If December 2025 M2SL is 22,300 (billions) and December 2026 first prints at 23,400, growth is 23,400 / 22,300 − 1 = 4.93%, which rounds to 4.9%. A contract for “above 4.9%” resolves No, because 4.9 is not above 4.9.
Download the data
Fed and macro indicator markets (one row per event) (CSV)
One row per live event: market middle, contracts listed and traded, and the latest official value. No contract prices or price histories. Free to reuse under CC BY 4.0 with a link back to this page.
Embed this chart
Methodology
- Markets. Open Kalshi events for each series, nearest close first, read from the public API. Prices are bid/ask midpoints (spread ≤10¢) or last trades, forced to fall as the threshold rises.
- Official values. FRED API (WALCL, NFCI, CFNAI, M2SL, PSAVERT, SAHMREALTIME, CIVPART), latest observation on the run date.
- No prices in the CSV. One row per event: middle, number of contracts, contracts traded, latest official value.
- Limits. Market middles are snapshots, not forecasts we endorse. Official values shown are the last published, not the period each market settles on. Thinly traded events are flagged. Nothing here is investment advice. Last run: Oct 23, 2026, 11:06 AM ET.
Cite this research
Suggested citation: PredictionScout. (2026, October 23). Fed and Macro Indicator Prediction Markets: Balance Sheet, NFCI, Sahm Rule. https://predictionscout.com/research/fed-economic-indicator-prediction-markets/
For a chart or news story: “Source: PredictionScout analysis of public exchange data (https://predictionscout.com/research/fed-economic-indicator-prediction-markets/)”
The data and charts on this page are free to reuse under CC BY 4.0 with a link back to this page. Market data: Kalshi. Official data: FRED (Federal Reserve Bank of St. Louis), Federal Reserve Board, Federal Reserve Bank of Chicago, BEA, BLS.
Data sources: prices and volumes come from the public APIs of Kalshi and Polymarket, with official values from FRED. All trademarks belong to their owners. PredictionScout is independent and not affiliated with any exchange. Nothing here is investment, betting, or legal advice.
Related: CPI markets · Jobs report markets · All research