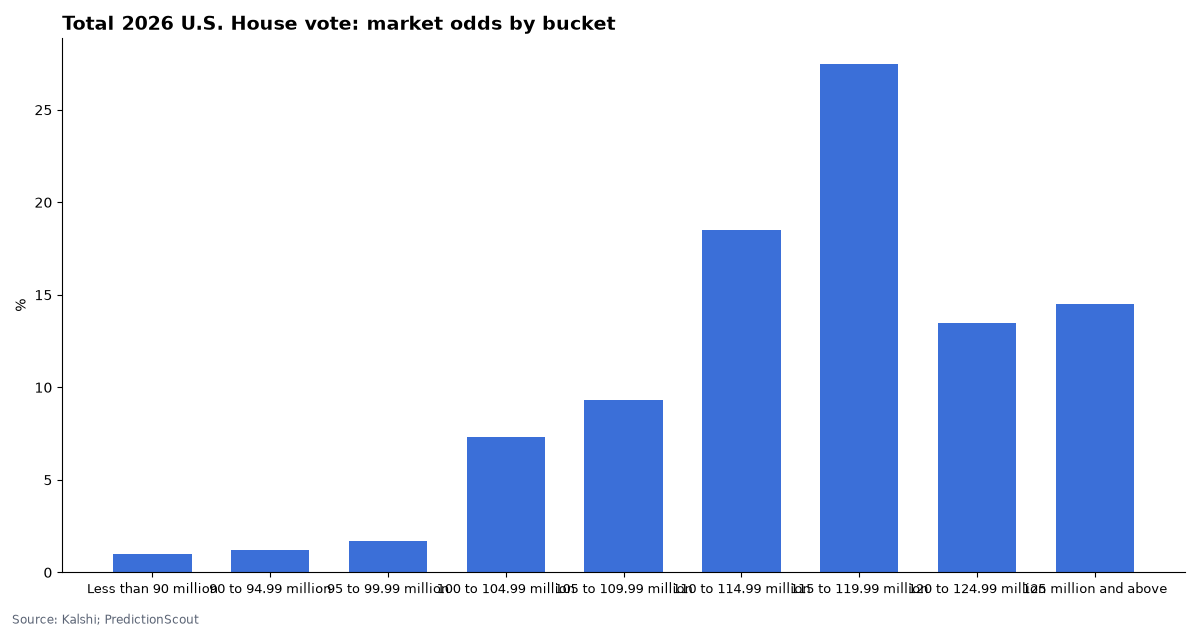
Kalshi lists turnout ladders for 502 individual 2026 races, 432 House districts, 35 Senate races and 35 governor’s races, plus a market on the national total for the House. That national market’s midpoint is about 116 million votes, against 106.8 million in the Clerk’s 2022 statistics and 112.8 million in 2018.
Every ladder pays on the certified total vote count for the race, not on registration or turnout percentages, so this page compares each market’s middle to the same race’s certified total in the last two midterms.
Kalshi market data and Clerk of the House statistics, pulled Oct 23, 2026, 10:24 AM ET. Updated daily.
By Arthur Angelo, PredictionScout Research · Updated Oct 23, 2026, 10:24 AM ET
Key findings
- 502 race-level turnout ladders. 90 have a readable middle from live quotes.
- National House vote: the market’s middle is about 116 million, against 112.8 million (2018) and 106.8 million (2022) in the Clerk’s statistics.
- Statewide middles versus 2018: the market expects the most growth in Texas Senate (+26%) and the least in Mississippi Senate (-21%).
How these markets work
The question. Each rung asks whether the total vote count for all candidates in one race will be above a number, such as “Texas Senate above 10.6 million.” It counts votes cast in that race, not ballots cast overall, so voters who skip a race don’t count. Write-ins count if the certifying authority reports them.
Settlement. Kalshi uses the officially certified result from the state’s election authority, regardless of pending appeals. Early, mail and provisional ballots count only if they are in the certified total. For ranked-choice races (Alaska, Maine) the certifying authority’s official count is used.
National House turnout. KXHOUSETURNOUT splits the total of all House votes nationwide into 5-million-vote buckets. Uncontested races matter here: some states, Florida among them, don’t print votes for unopposed candidates, which lowers the national total.
What moves the price. Early and mail-ballot returns, registration, how competitive the top race is, weather and, for House districts, redistricting and whether the seat is contested at all.
Worked example: Texas Senate
The Clerk’s 2018 statistics record 8,371,655 votes in the Texas Senate race (Ted Cruz 4,260,553, Beto O’Rourke 4,045,632, Neal Dikeman 65,470). Kalshi’s 2026 ladder today: >8.20M: 94%, >8.80M: 85%, >9.40M: 80%, >10.00M: 62%, >10.30M: 54%, >10.60M: 50%. Its middle is about 10.57M, +26% on 2018. If the certified 2026 total were 10.4 million, every rung at 10.4 million or below would pay Yes and every rung above it would pay No.
National House turnout
| Bucket | Chance | Volume |
|---|---|---|
| Less than 90 million | 1% | 12,946 |
| 90 to 94.99 million | 1% | 10,269 |
| 95 to 99.99 million | 2% | 10,379 |
| 100 to 104.99 million | 7% | 8,861 |
| 105 to 109.99 million | 9% | 5,801 |
| 110 to 114.99 million | 18% | 10,863 |
| 115 to 119.99 million | 28% | 12,809 |
| 120 to 124.99 million | 14% | 15,858 |
| 125 million and above | 15% | 34,157 |
For comparison, the Clerk’s statistics total 112,807,270 House votes in 2018 and 106,807,534 in 2022.
Senate races
“Middle” is where the ladder crosses 50%, after forcing it to fall as the threshold rises. Prior totals are that state’s certified Senate vote in the Clerk’s statistics (a dash means no Senate race that year). The change compares the middle with 2018.
| Race | Ladder (live quotes) | Middle | 2018 total | 2022 total | Middle vs 2018 | Volume |
|---|---|---|---|---|---|---|
| Texas Senate | >8.20M: 94%, >8.80M: 85%, >9.40M: 80%, >10.00M: 62%, >10.30M: 54%, >10.60M: 50% | 10.57M | 8.37M | — | +26% | 36,848 |
| Michigan Senate | >3.80M: 94%, >4.10M: 90%, >5.00M: 46%, >5.30M: 29%, >5.60M: 24%, >5.90M: 13% | 4.93M | 4.21M | — | +17% | 14,527 |
| Maine Senate | >460k: 96%, >540k: 96%, >860k: 18%, >940k: 9%, >980k: 6% | 727k | 634k | — | +15% | 12,928 |
| North Carolina Senate | >3.40M: 96%, >3.60M: 96%, >3.80M: 90%, >3.90M: 81%, >4.10M: 60%, >4.70M: 7% | 4.21M | — | 3.77M | — | 8,017 |
| Arkansas Senate | >750k: 96%, >900k: 67%, >1.12M: 5%, >1.16M: 4% | 960k | — | 901k | — | 7,906 |
| Alaska Senate | >260k: 60% | — | — | 260k | — | 6,978 |
| Minnesota Senate | >2.20M: 92%, >3.70M: 4% | 2.92M | 2.60M | — | +13% | 6,456 |
| Ohio Senate | >3.90M: 84%, >4.10M: 73%, >5.10M: 22%, >5.90M: 6% | 4.55M | 4.41M | 4.13M | +3% | 5,732 |
| Georgia Senate | >3.10M: 94%, >3.50M: 84%, >3.90M: 71%, >4.70M: 20%, >5.10M: 10% | 4.23M | — | 3.94M | — | 5,529 |
| Iowa Senate | >1.10M: 95%, >1.52M: 22%, >1.58M: 14%, >1.70M: 6% | 1.36M | — | 1.21M | — | 4,593 |
| Louisiana Senate | >1.84M: 6% | — | — | 1.38M | — | 4,077 |
| South Carolina Senate | no live quotes | — | — | 1.69M | — | 4,059 |
| Delaware Senate | >440k: 19% | — | 363k | — | — | 3,969 |
| Wyoming Senate | >170k: 87%, >180k: 82%, >230k: 13%, >240k: 6%, >250k: 6%, >260k: 4% | 203k | 203k | — | +0% | 3,730 |
| Idaho Senate | >470k: 95%, >650k: 44%, >680k: 32%, >710k: 27% | 627k | — | 591k | — | 2,905 |
| Florida Senate | >5.80M: 96%, >6.20M: 94%, >8.10M: 53%, >10.90M: 6% | 8.28M | 8.19M | 7.76M | +1% | 2,819 |
| Kansas Senate | >900k: 92%, >1.06M: 71% | — | — | 1.00M | — | 2,666 |
| New Jersey Senate | no live quotes | — | 3.17M | — | — | 2,558 |
| New Hampshire Senate | >560k: 84%, >590k: 75%, >740k: 15%, >800k: 6% | 652k | — | 621k | — | 2,414 |
| Oregon Senate | >2.10M: 33%, >2.30M: 18% | — | — | 1.93M | — | 2,326 |
| Alabama Senate | >1.41M: 80%, >1.63M: 42% | 1.58M | — | 1.41M | — | 1,916 |
| Nebraska Senate | >870k: 20% | — | 699k | — | — | 1,854 |
| South Dakota Senate | >260k: 94% | — | — | 348k | — | 1,814 |
| Virginia Senate | >3.00M: 67%, >4.20M: 6% | 3.33M | 3.35M | — | -0% | 1,769 |
| Oklahoma Senate | >1.00M: 81% | — | — | 1.15M | — | 1,567 |
| Tennessee Senate | >1.60M: 92%, >2.80M: 6%, >3.20M: 3% | 2.18M | 2.24M | — | -3% | 1,518 |
| Massachusetts Senate | >2.00M: 94%, >3.20M: 13% | 2.66M | 2.70M | — | -2% | 1,467 |
| Illinois Senate | >3.30M: 94%, >3.50M: 89%, >4.30M: 44%, >4.90M: 12% | 4.19M | — | 4.10M | — | 1,443 |
| West Virginia Senate | >390k: 96% | — | 586k | — | — | 1,193 |
| Mississippi Senate | >530k: 96%, >770k: 58%, >1.29M: 3% | 846k | 1.08M | — | -21% | 1,146 |
| Colorado Senate | no live quotes | — | — | 2.50M | — | 798 |
| Montana Senate | >440k: 72%, >650k: 6% | 510k | 504k | — | +1% | 779 |
| Kentucky Senate | >1.27M: 94% | — | — | 1.48M | — | 666 |
| New Mexico Senate | >1.05M: 3% | — | 697k | — | — | 655 |
| Rhode Island Senate | >280k: 96%, >540k: 3% | 409k | 376k | — | +9% | 327 |
Governor races
The Clerk doesn’t report governor’s races, so the comparison is the same state’s certified Senate vote in the same year, a close proxy for statewide turnout. A dash means the state had no Senate race that year.
| Race | Ladder (live quotes) | Middle | 2018 Senate total | 2022 Senate total | Middle vs 2018 | Volume |
|---|---|---|---|---|---|---|
| California Governor | >10.00M: 94%, >10.90M: 84%, >11.50M: 74%, >12.00M: 64%, >12.60M: 50%, >13.10M: 42% | 12.60M | 11.11M | 10.84M | +13% | 50,941 |
| Georgia Governor | >3.30M: 96%, >3.50M: 94%, >4.10M: 74%, >4.30M: 56% | — | — | 3.94M | — | 7,134 |
| Hawaii Governor | >310k: 94%, >470k: 12%, >490k: 8% | 396k | 388k | 409k | +2% | 6,974 |
| Alabama Governor | >1.28M: 94% | — | — | 1.41M | — | 6,444 |
| Wisconsin Governor | >2.60M: 55% | — | 2.66M | 2.65M | — | 5,601 |
| Alaska Governor | >270k: 68%, >290k: 50% | — | — | 260k | — | 5,584 |
| Minnesota Governor | >2.70M: 42%, >3.00M: 20% | — | 2.60M | — | — | 3,728 |
| Texas Governor | >7.50M: 95%, >9.20M: 70%, >11.50M: 20%, >12.00M: 14% | 10.13M | 8.37M | — | +21% | 3,690 |
| Michigan Governor | >3.80M: 94%, >5.30M: 32%, >5.50M: 24% | 4.86M | 4.21M | — | +15% | 2,839 |
| Idaho Governor | >470k: 96%, >500k: 95% | — | — | 591k | — | 2,702 |
| Vermont Governor | no live quotes | — | 272k | 286k | — | 2,681 |
| Nevada Governor | >970k: 78%, >1.22M: 21%, >1.27M: 12% | 1.09M | 957k | 1.01M | +14% | 2,573 |
| Maine Governor | no live quotes | — | 634k | — | — | 2,452 |
| Florida Governor | >7.30M: 70%, >8.50M: 32% | 7.93M | 8.19M | 7.76M | -3% | 2,315 |
| New York Governor | >6.10M: 55%, >7.50M: 7% | 6.25M | 5.49M | 5.25M | +14% | 2,206 |
| Arkansas Governor | no live quotes | — | — | 901k | — | 1,628 |
| Connecticut Governor | >1.09M: 77% | — | 1.35M | 1.24M | — | 1,588 |
| Iowa Governor | >1.22M: 79% | — | — | 1.21M | — | 1,419 |
| South Carolina Governor | >1.95M: 32%, >2.00M: 29% | — | — | 1.69M | — | 1,389 |
| Ohio Governor | >4.10M: 65% | — | 4.41M | 4.13M | — | 1,344 |
| Colorado Governor | >2.00M: 94%, >3.00M: 20% | 2.59M | — | 2.50M | — | 1,265 |
| Oklahoma Governor | no live quotes | — | — | 1.15M | — | 1,258 |
| Pennsylvania Governor | >4.00M: 94%, >6.20M: 21% | 5.33M | 5.01M | 5.37M | +6% | 1,085 |
| Arizona Governor | >2.30M: 83%, >2.60M: 57%, >3.10M: 16% | 2.68M | 2.33M | 2.57M | +15% | 869 |
| Massachusetts Governor | no live quotes | — | 2.70M | — | — | 836 |
| Tennessee Governor | no live quotes | — | 2.24M | — | — | 756 |
| Kansas Governor | >810k: 96%, >860k: 94%, >1.36M: 6% | 1.11M | — | 1.00M | — | 508 |
| Maryland Governor | >1.70M: 94%, >2.30M: 31% | 2.12M | 2.30M | 2.00M | -8% | 465 |
| South Dakota Governor | >460k: 5% | — | — | 348k | — | 438 |
| Wyoming Governor | >220k: 18%, >230k: 11% | — | 203k | — | — | 319 |
| Oregon Governor | >2.00M: 51% | — | — | 1.93M | — | 302 |
| Rhode Island Governor | >460k: 6% | — | 376k | — | — | 209 |
| Illinois Governor | no live quotes | — | — | 4.10M | — | 162 |
| New Mexico Governor | >820k: 18%, >880k: 8%, >910k: 6% | — | 697k | — | — | 96 |
| New Hampshire Governor | no live quotes | — | — | 621k | — | 22 |
House districts (busiest 40)
Compared with the same district number in 2018 and 2022. Some states redrew their lines after 2022, so a district number may not cover the same voters. The change compares the middle with 2022. Every district is in the CSV.
| District | Ladder (live quotes) | Middle | 2018 total | 2022 total | Middle vs 2022 | Volume |
|---|---|---|---|---|---|---|
| New Jersey House district 7 | >240k: 96%, >260k: 96%, >280k: 96%, >290k: 94%, >320k: 64% | — | 323k | 310k | — | 5,466 |
| New Jersey House district 8 | no live quotes | — | 153k | 106k | — | 4,953 |
| Wisconsin House district 2 | >200k: 95% | — | 309k | 378k | — | 4,869 |
| Rhode Island House district 2 | >191k: 78%, >210k: 49%, >260k: 6% | 209k | 199k | 201k | +4% | 4,845 |
| California House district 42 | >320k: 4%, >340k: 3% | — | 232k | 145k | — | 4,806 |
| Massachusetts House district 2 | >120k: 96%, >150k: 96% | — | 285k | 273k | — | 4,200 |
| Louisiana House district 6 | >60k: 96% | — | 269k | 236k | — | 4,022 |
| Louisiana House district 5 | >60k: 96% | — | 224k | 224k | — | 3,838 |
| Massachusetts House district 5 | >160k: 95% | — | 311k | 275k | — | 3,605 |
| California House district 12 | >145k: 96%, >155k: 95% | — | 317k | 240k | — | 3,539 |
| Rhode Island House district 1 | no live quotes | — | 174k | 156k | — | 3,474 |
| Oregon House district 1 | >220k: 96%, >250k: 96% | — | 363k | 310k | — | 3,194 |
| California House district 4 | >160k: 96%, >170k: 96%, >180k: 96%, >190k: 95%, >200k: 93%, >210k: 89% | 272k | 341k | 261k | +4% | 3,149 |
| Oregon House district 3 | >210k: 96% | — | 384k | 303k | — | 2,902 |
| Alaska House at-large | >280k: 56%, >290k: 47% | 287k | 281k | 263k | +9% | 2,822 |
| California House district 48 | >276k: 9% | — | 295k | 257k | — | 2,662 |
| Florida House district 10 | >230k: 4% | — | — | 200k | — | 2,656 |
| California House district 7 | >128k: 96%, >166k: 96% | — | 282k | 221k | — | 2,553 |
| California House district 11 | >270k: 45%, >300k: 36% | — | 276k | 263k | — | 2,474 |
| California House district 1 | >180k: 96% | — | 292k | 246k | — | 2,417 |
| Washington House district 3 | >240k: 96%, >260k: 93%, >330k: 52%, >370k: 26% | 333k | 307k | 318k | +5% | 2,383 |
| Maine House district 2 | >420k: 6%, >440k: 4% | — | 281k | 22k | — | 2,370 |
| New York House district 10 | no live quotes | — | 196k | 189k | — | 2,249 |
| Virginia House district 2 | >230k: 95% | — | 273k | 297k | — | 2,227 |
| Florida House district 12 | >230k: 96% | — | 335k | 322k | — | 2,011 |
| Virginia House district 10 | >200k: 96%, >240k: 94%, >270k: 84% | — | 367k | 296k | — | 1,919 |
| California House district 34 | >70k: 96%, >75k: 96%, >80k: 96%, >85k: 96%, >90k: 96%, >95k: 94% | — | 152k | 121k | — | 1,820 |
| California House district 14 | >80k: 96% | — | 267k | 198k | — | 1,820 |
| California House district 2 | >220k: 96% | — | 316k | 309k | — | 1,800 |
| Arizona House district 3 | no live quotes | — | 180k | 141k | — | 1,709 |
| Massachusetts House district 7 | >100k: 96%, >200k: 4% | 151k | 217k | 179k | -16% | 1,700 |
| California House district 37 | >77k: 95% | — | 236k | 132k | — | 1,600 |
| California House district 6 | no live quotes | — | 202k | 216k | — | 1,517 |
| Virginia House district 1 | >270k: 96%, >500k: 4% | 385k | 332k | 342k | +12% | 1,426 |
| Pennsylvania House district 3 | >140k: 95% | — | 308k | 264k | — | 1,400 |
| California House district 19 | no live quotes | — | 220k | 283k | — | 1,400 |
| California House district 40 | >140k: 96%, >160k: 94% | — | 121k | 284k | — | 1,305 |
| New York House district 12 | >170k: 95% | — | 240k | 226k | — | 1,286 |
| California House district 8 | >144k: 94%, >280k: 7% | 213k | 171k | 192k | +11% | 1,222 |
| New York House district 17 | >220k: 97%, >250k: 82%, >260k: 72% | — | 183k | 259k | — | 1,210 |
Scoring after certification
We save every ladder daily and will store a final snapshot on the evening of November 3. Once states certify, each ladder will be scored against the certified total: which rungs paid, and how far the middle was from the actual count.
Download the data
Race turnout ladders today (CSV)National House turnout buckets today (CSV)
Today’s ladders (one row per rung) with 2018 and 2022 certified totals, and the national House buckets. No price histories are included. Free to reuse under CC BY 4.0 with a link back to this page.
Embed this chart
Methodology
- Markets. Every open Kalshi
KXMIDTERMVOTETURNandKXHOUSETURNOUTcontract, read from the public API with full paging. - Prices. Bid/ask midpoint, only where the two-sided spread is 10¢ or less. Ladders are forced to fall as the threshold rises before we read the middle; national buckets are normalized to sum to 100% and interpolated within the bucket.
- Certified totals. The Clerk of the House’s “Statistics of the Congressional Election” for 2018 and 2022: all candidates in each race, using Georgia’s November 2022 general-election Senate count from the Clerk’s footnote rather than the December runoff.
- Scoring. Daily snapshots are stored; scoring begins once each state certifies.
- Limits. Nothing has settled yet; these are today’s odds, not a track record. Redistricting changes some districts between cycles. The governor comparison uses the Senate vote as a proxy. Nothing here is investment advice. Last run: Oct 23, 2026, 10:24 AM ET.
Cite this research
Suggested citation: PredictionScout. (2026, October 23). Turnout Prediction Markets for 2026: Total Votes by Race. https://predictionscout.com/research/turnout-prediction-markets/
For a chart or news story: “Source: PredictionScout analysis of public exchange data (https://predictionscout.com/research/turnout-prediction-markets/)”
The data and charts on this page are free to reuse under CC BY 4.0 with a link back to this page. Market data: Kalshi. Certified totals: Clerk of the U.S. House of Representatives.
Data sources: prices and volumes come from the public APIs of Kalshi and Polymarket, with certified totals from the Clerk of the House. All trademarks belong to their owners. PredictionScout is independent and not affiliated with any exchange. Nothing here is investment, betting, or legal advice.
Related: House vote and seat markets · North Carolina early-vote tracker · All research