Kalshi lists 503 margin-of-victory ladders and 750 candidate vote-share ladders for the 2026 elections. The busiest is James Talarico in the Texas Senate race.
None of these settle on election night. Each pays on the certified result, which states publish weeks later, so this page shows today’s odds next to the last certified result for the same seat and will score every ladder after certification.
Kalshi market data and Clerk of the House statistics, pulled Oct 23, 2026, 8:37 AM ET. Updated daily.
By Arthur Angelo, PredictionScout Research · Updated Oct 23, 2026, 8:37 AM ET
Key findings
- 503 margin ladders, 750 vote-share ladders. All settle on certified results, weeks after Election Day.
- Busiest margin market: James Talarico (Texas Senate): 1+: 64%, 2+: 44%, 3+: 32%, 4+: 30%, 5+: 20%, 6+: 16%, 7+: 11%, 8+: 6%, 9+: 6%. Last time, 2020: John Cornyn won by 9.6 points.
- Ladders favoring a different party than last time. Texas Senate: Democratic by 1+ at 64%, where 2020 went R+9.6; Maine Senate: Democratic by 1+ at 58%, where 2020 went R+8.6; North Carolina Senate: Democratic by 1+ at 97%, where 2020 went R+1.7; Ohio Senate: Democratic by 1+ at 64%, where 2022 went R+6.1; Virginia Senate: Republican by 26+ at 93%, where 2020 went D+12.1.
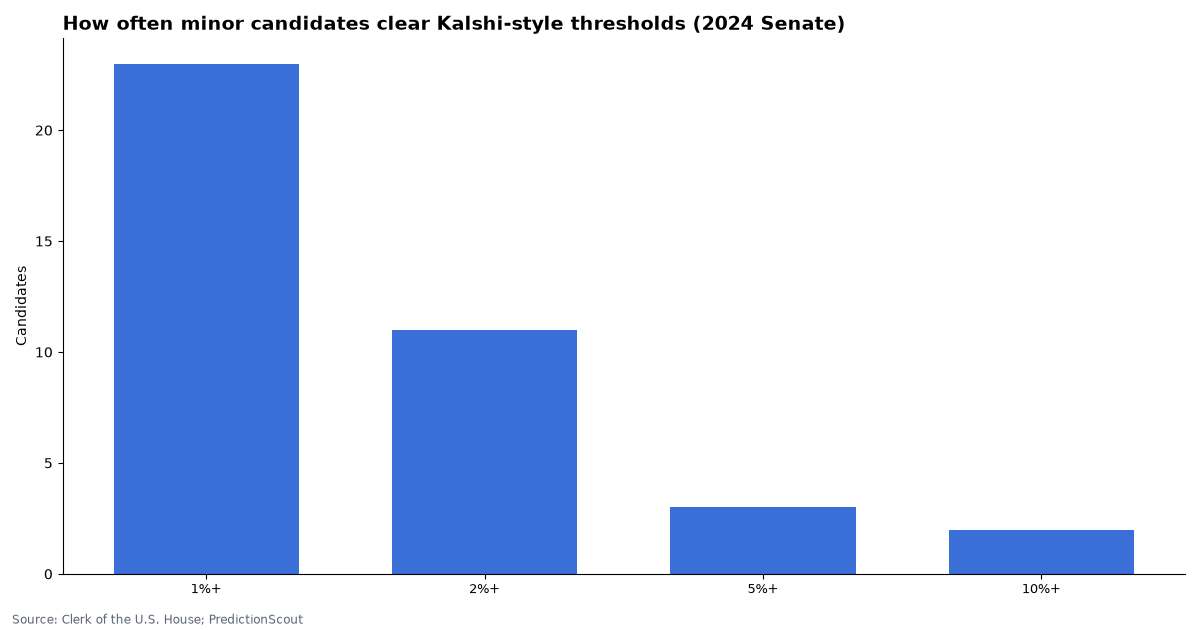
- Third parties. 51 ladders cover candidates with low thresholds. In 2024, 11 non-major-party Senate candidates reached 2% of the certified vote.
How these markets work
Margin of victory. Each contract asks whether one party’s candidate wins a race by at least a set number of percentage points, such as “Democrats win the Texas Senate race by 2+ points.” The margin is the winner’s share of all votes minus the runner-up’s. If the named party loses, every rung of its ladder pays No. The two parties’ ladders are separate markets.
Vote share. Each contract asks whether a candidate gets at least X% of the certified popular vote, counting both endpoints. In Alaska and Louisiana the ladders settle on the first round.
Settlement. Both use the certified count from the state’s certifying authority, not election-night tallies or media calls. Certification usually takes two to five weeks after November 3, and recounts can delay it.
What moves the price. Polls, early-vote and mail-ballot data, candidate news, spending, and, close to the end, partial counts. Vote-share ladders for small candidates also move on ballot access and on whether the race is competitive, since minor-party voters often switch when the race is close.
Worked example: Texas Senate, 2024
The Clerk of the House records Ted Cruz (Republican) at 5,990,741 votes, Colin Allred (Democrat) at 5,031,249, and Ted Brown (Libertarian) at 267,039, out of 11,291,854 total. Cruz’s share was 53.05% and Allred’s 44.56%, a margin of 8.50 points. Under these rules a “Republicans win by 5+” contract would have paid Yes, “Republicans win by 9+” No, and every “Democrats win by X+” contract No. Brown’s 2.36% would have paid “at least 2%” but not “at least 3%.”
Margin-of-victory ladders, today
Chances are the bid/ask midpoint for each rung with a live two-sided quote (rungs with no quote are left out), forced to fall as the threshold rises. “Middle” is where that party’s ladder crosses 50%; a dash means it doesn’t. The last result is the Clerk’s certified count for the last election to the same Senate seat (2020 for the regular seats, 2022 for the specials; left blank where a state held two Senate races that year); governors are not in the Clerk’s statistics.
| Race | Ladder | Chances | Middle | Last certified result | Volume |
|---|---|---|---|---|---|
| Texas Senate | James Talarico | Democratic by… 1+: 64%, 2+: 44%, 3+: 32%, 4+: 30%, 5+: 20%, 6+: 16%, 7+: 11%, 8+: 6%, 9+: 6% | D+1.7 | 2020: John Cornyn (R) by 9.6 | 981,547 |
| Texas Senate | Ken Paxton | Republican by… 1+: 32%, 2+: 25%, 3+: 22%, 4+: 13%, 5+: 13%, 6+: 8%, 7+: 8%, 8+: 6%, 9+: 5%, 11+: 2%, 13+: 2% | — | 2020: John Cornyn (R) by 9.6 | 935,486 |
| Michigan Senate | El-Sayed | Democratic by… 1+: 64%, 2+: 58%, 3+: 46%, 4+: 42%, 5+: 34%, 6+: 24%, 7+: 16%, 8+: 12%, 9+: 11%, 11+: 5%, 13+: 5%, 15+: 5% | D+2.7 | 2020: Gary C. Peters (D) by 1.7 | 491,675 |
| Maine Senate | Jackson | Democratic by… 1+: 58%, 3+: 42%, 4+: 32%, 5+: 23%, 6+: 20%, 7+: 15%, 9+: 10%, 11+: 6%, 13+: 4% | D+2.1 | 2020: Susan M. Collins (R) by 8.6 | 277,488 |
| Florida Senate | Moody | Republican by… 1+: 88%, 2+: 88%, 3+: 84%, 4+: 84%, 5+: 74%, 6+: 72%, 7+: 60%, 8+: 52%, 9+: 45%, 10+: 38%, 11+: 30%, 12+: 21%, 14+: 14%, 16+: 7%, 18+: 3% | R+8.3 | 2022: Marco Rubio (R) by 16.4 | 199,660 |
| Texas Governor | Abbott | Republican by… 1+: 64%, 3+: 52%, 5+: 34%, 6+: 28%, 7+: 26%, 9+: 15%, 12+: 8%, 15+: 5% | R+3.2 | — | 193,530 |
| Georgia Senate | Ossoff | Democratic by… 2+: 95%, 3+: 90%, 4+: 86%, 5+: 81%, 6+: 78%, 7+: 73%, 8+: 70%, 9+: 62%, 10+: 56%, 11+: 46%, 12+: 40%, 13+: 0%, 14+: 0%, 16+: 0%, 18+: 0% | D+10.6 | — | 179,346 |
| North Carolina Senate | Cooper | Democratic by… 1+: 97%, 2+: 95%, 3+: 93%, 4+: 91%, 5+: 90%, 6+: 87%, 7+: 84%, 8+: 77%, 9+: 68%, 10+: 64%, 11+: 58%, 12+: 50%, 13+: 38%, 14+: 34%, 15+: 28%, 17+: 17%, 19+: 11%, 21+: 5% | D+12.0 | 2020: Thom Tillis (R) by 1.7 | 159,091 |
| South Carolina Senate | Graham | Republican by… 1+: 77%, 2+: 66%, 3+: 64%, 4+: 52%, 5+: 47%, 6+: 34%, 7+: 34%, 8+: 20%, 9+: 19%, 11+: 8%, 13+: 7%, 15+: 5%, 17+: 2%, 19+: 2% | R+4.4 | 2020: Lindsey Graham (R) by 10.3 | 156,379 |
| Minnesota Senate | Flanagan | Democratic by… 1+: 83%, 2+: 78%, 3+: 74%, 5+: 62%, 7+: 46%, 8+: 42%, 9+: 29%, 11+: 18%, 13+: 12%, 15+: 7%, 17+: 6%, 19+: 3%, 21+: 1% | D+6.4 | 2020: Tina Smith (D) by 5.2 | 145,107 |
| Maine Senate | Collins | Republican by… 1+: 30%, 2+: 26%, 3+: 24%, 4+: 16%, 5+: 12%, 6+: 10%, 7+: 7%, 8+: 6%, 10+: 3%, 12+: 2% | — | 2020: Susan M. Collins (R) by 8.6 | 114,817 |
| Florida Governor | Donalds | Republican by… 1+: 80%, 3+: 72%, 6+: 48%, 9+: 30%, 12+: 17%, 15+: 8%, 18+: 3% | R+5.8 | — | 109,386 |
| Ohio Governor | Acton | Democratic by… 1+: 81%, 2+: 76%, 3+: 70%, 4+: 64%, 5+: 57%, 6+: 46%, 7+: 40%, 8+: 30%, 9+: 26%, 12+: 14%, 15+: 5% | D+5.6 | — | 89,328 |
| Ohio Senate | Brown | Democratic by… 1+: 64%, 2+: 58%, 4+: 44%, 5+: 34%, 6+: 22%, 7+: 20%, 8+: 18%, 9+: 13%, 10+: 10% | D+3.2 | 2022: JD Vance (R) by 6.1 | 88,555 |
| Iowa Governor | Sand | Democratic by… 1+: 84%, 3+: 68%, 6+: 45%, 9+: 26%, 12+: 12%, 15+: 4% | D+5.4 | — | 78,974 |
| Kansas Senate | Marshall | Republican by… 1+: 54%, 3+: 38%, 5+: 26%, 7+: 16%, 9+: 9%, 11+: 4%, 13+: 3%, 15+: 3% | R+1.5 | 2020: Roger W. Marshall (R) by 11.4 | 77,913 |
| Mississippi Senate | Hyde-Smith | Republican by… 1+: 87%, 3+: 82%, 5+: 70%, 7+: 51%, 9+: 42%, 11+: 26%, 13+: 18% | R+7.2 | 2020: Cindy Hyde-Smith (R) by 10.0 | 76,963 |
| Ohio Senate | Husted | Republican by… 1+: 27%, 2+: 22%, 4+: 12%, 5+: 8%, 6+: 8%, 7+: 5%, 8+: 5%, 10+: 5% | — | 2022: JD Vance (R) by 6.1 | 61,605 |
| New Hampshire Senate | Pappas | Democratic by… 2+: 88%, 4+: 79%, 6+: 67%, 7+: 0%, 8+: 0%, 10+: 0%, 12+: 0%, 14+: 0%, 16+: 0%, 18+: 0% | D+6.3 | 2020: Jeanne Shaheen (D) by 15.7 | 60,341 |
| Wisconsin Governor | Crowley | Democratic by… 1+: 72%, 4+: 52%, 5+: 44%, 6+: 37%, 7+: 29%, 10+: 14%, 13+: 6%, 16+: 3%, 19+: 2% | D+4.3 | — | 52,758 |
| Michigan Senate | Rogers | Republican by… 1+: 26%, 3+: 12%, 4+: 10%, 5+: 7%, 6+: 5% | — | 2020: Gary C. Peters (D) by 1.7 | 50,843 |
| Iowa Senate | Turek | Democratic by… 1+: 32%, 2+: 32%, 3+: 22%, 4+: 18%, 5+: 13%, 6+: 10% | — | 2020: Joni Ernst (R) by 6.6 | 44,720 |
| Ohio House | Miller | Republican by… 1+: 8%, 4+: 7%, 10+: 4%, 13+: 4%, 16+: 3% | — | — | 41,717 |
| New York Governor | Hochul | Democratic by… 4+: 91%, 7+: 84%, 10+: 76%, 13+: 60%, 16+: 44%, 19+: 28%, 22+: 21% | D+14.9 | — | 41,478 |
| Michigan House | Bergman | Republican by… 1+: 86%, 10+: 56%, 13+: 43% | R+11.4 | — | 40,716 |
| Arizona House | Feely | Republican by… 1+: 12%, 4+: 5% | — | — | 37,389 |
| Iowa Senate | Hinson | Republican by… 1+: 46%, 2+: 42%, 4+: 28%, 6+: 16%, 8+: 9%, 10+: 5%, 12+: 3%, 14+: 3% | — | 2020: Joni Ernst (R) by 6.6 | 36,360 |
| Arizona Governor | Hobbs | Democratic by… 2+: 85%, 5+: 70%, 8+: 50%, 11+: 30%, 14+: 13%, 17+: 4% | D+7.9 | — | 36,339 |
| Connecticut House | Bronin | Democratic by… 22+: 91%, 25+: 82%, 28+: 72%, 31+: 57%, 34+: 43% | D+32.5 | — | 35,035 |
| Minnesota Governor | Klobuchar | Democratic by… 2+: 93%, 5+: 84%, 8+: 68%, 11+: 54%, 14+: 32%, 17+: 16%, 20+: 11%, 23+: 5%, 26+: 3% | D+11.5 | — | 33,648 |
Candidate vote-share ladders, today
The 25 busiest ladders for candidates whose ladders reach above 20%.
| Candidate | Race | At least… | Middle | Volume |
|---|---|---|---|---|
| Dan McKay | LA-05 House | 2+: 96%, 4+: 95%, 14+: 5% | 9.0% | 31,427 |
| David Crowley | Wisconsin gubernatorial | 48+: 94%, 50+: 76%, 52+: 47%, 54+: 20%, 56+: 6% | 51.8% | 26,240 |
| Caleb Walker | LA-03 House | 2+: 96%, 4+: 96% | — | 22,039 |
| Susan Collins | Maine Senate | 40+: 96%, 42+: 96%, 44+: 94%, 52+: 13%, 54+: 5%, 56+: 3% | 48.3% | 18,452 |
| Troy Jackson | Maine Senate | 40+: 96%, 42+: 96%, 48+: 84% | — | 18,065 |
| Matt Gromlich | LA-04 House | 6+: 92%, 12+: 25%, 16+: 6%, 38+: 3% | 9.8% | 17,919 |
| Jonathan Kreiss-Tomkins | Alaska gubernatorial | 38+: 91%, 46+: 30%, 48+: 15%, 50+: 8%, 52+: 5%, 54+: 2% | 43.4% | 14,664 |
| Kathy Hochul | New York gubernatorial | 50+: 94%, 52+: 92%, 56+: 58% | — | 14,366 |
| Chris Stigall | MO-06 House | 52+: 96%, 54+: 95%, 56+: 92%, 70+: 5%, 72+: 3% | 62.7% | 13,037 |
| Brandon Herrera | TX-23 House | 50+: 58%, 56+: 9%, 58+: 5% | 51.0% | 12,980 |
| Kurt Alme | Montana Senate | 35+: 96%, 55+: 5%, 60+: 3% | 45.1% | 12,643 |
| Seth Bodnar | Montana Senate | 15+: 98%, 20+: 96%, 25+: 96%, 30+: 94%, 45+: 5% | 37.4% | 11,708 |
| Everett Jackson | TX-30 House | 12+: 96%, 14+: 94%, 16+: 94% | — | 11,518 |
| Alani Bankhead | Montana Senate | 10+: 82%, 25+: 6%, 30+: 3%, 35+: 3% | 16.4% | 11,097 |
| Mark Alford | MO-04 House | 50+: 96%, 52+: 96%, 54+: 96%, 56+: 94%, 58+: 89%, 70+: 6%, 72+: 5%, 74+: 3% | 63.7% | 11,050 |
| Melissa McDonough | TX-38 House | 34+: 96%, 36+: 95%, 46+: 25%, 48+: 12%, 50+: 5% | 42.4% | 10,073 |
| Brad Little | Idaho gubernatorial | 50+: 94%, 54+: 88%, 56+: 76%, 60+: 42%, 66+: 6% | 59.1% | 9,879 |
| Ashley Moody | Florida Senate | 50+: 89%, 52+: 73%, 53+: 62% | — | 9,562 |
| Don Beyer | VA-08 House | 78+: 57%, 84+: 6%, 86+: 5%, 88+: 3%, 90+: 3%, 92+: 3% | 78.8% | 8,462 |
| James Talarico | Texas Senate | 44+: 96%, 46+: 92%, 50+: 50%, 54+: 10%, 56+: 3% | 50.0% | 8,343 |
| Bob Onder | MO-03 House | 50+: 96%, 52+: 94% | — | 8,330 |
| Hillary Scholten | MI-03 House | 50+: 94%, 52+: 90% | — | 8,206 |
| Dave Bronson | Alaska gubernatorial | 10+: 96%, 12+: 92%, 16+: 52%, 18+: 25%, 22+: 5%, 24+: 3%, 26+: 3% | 16.1% | 8,072 |
| Marsha Blackburn | Tennessee gubernatorial | 46+: 84%, 50+: 47%, 58+: 5% | 49.7% | 8,011 |
| Jocelyn Benson | Michigan gubernatorial | 50+: 86%, 60+: 6% | 54.5% | 7,645 |
Third-party and independent candidates
Kalshi’s busiest vote-share ladders are often the low ones: will a minor-party or independent candidate reach 1%, 2% or 5%? In the Clerk’s 2024 Senate results, 23 non-major-party candidates across 34 races reached 1%, 11 reached 2% and 3 reached 5%. The largest shares: Angus S. King, Jr. (Independent, ME) 52.1%; Dan Osborn (By Petition, NE) 46.7%; Carlton E. Bowen (Independent American, UT) 5.7%; Michael “Dr. Mike” Katz (Independent, DE) 3.9%; David Moran (Libertarian, WV) 3.5%; Don Kissick (Libertarian, OH) 3.4%.
Ladders whose highest rung is 20% or lower, busiest first:
| Candidate | Race | At least 1% | At least 2% | At least 5% | Volume |
|---|---|---|---|---|---|
| Wayne Thornton | CO-04 House | 6% | — | — | 35,890 |
| Tim Veldhuizen | CO-04 House | 7% | — | — | 35,485 |
| Joe Krzeczkowski | CO-07 House | — | — | 5% | 33,830 |
| Jacob Gottfredson | UT-04 House | 3% | 3% | 3% | 31,540 |
| Brian Jordan | MD-05 House | — | — | — | 29,456 |
| Nickie Kane | NY-10 House | 14% | — | — | 22,648 |
| Andy Kaplan | SC-05 House | 18% | — | — | 19,792 |
| Jordan Maggio | NY-01 House | — | 4% | — | 15,588 |
| Bob Cohen | NY-13 House | 4% | 4% | 4% | 13,690 |
| Critter Milton | CO-01 House | — | — | — | 10,933 |
| Nancy Wallace | MD-08 House | — | — | — | 10,002 |
| Karen Ortiz | NY-12 House | 17% | — | — | 8,544 |
| Kloud Walton | NY-25 House | 8% | — | — | 7,936 |
| Ted Brown | Texas Senate | — | 60% | — | 7,679 |
| Treg Taylor | Alaska gubernatorial | — | 96% | — | 7,427 |
| Shimon Blau | CO-01 House | — | — | — | 6,979 |
| Jessica Ethridge | SC-04 House | — | — | — | 6,893 |
| Steven Burt | UT-04 House | — | 66% | — | 6,740 |
| Taylor Wright | UT-04 House | — | — | — | 6,452 |
| Moshe Landman | MD-06 House | — | — | 6% | 6,110 |
| Wilneida Negron | NY-12 House | — | — | — | 5,773 |
| Clifton Brown | CO-03 House | — | — | — | 5,713 |
| Natalie Fleming | Idaho Senate | — | — | — | 5,511 |
| George McDermott | MD-04 House | — | — | — | 5,139 |
| Chad Humphrey | CO-01 House | — | — | — | 4,553 |
Scoring after certification
We save the full set of ladders every day and will store a final snapshot on the evening of November 3. Once states certify, each ladder will be scored against the certified count: which rungs paid, where the certified result fell relative to the market’s middle, and how far the middle was off.
Download the data
Margin ladders today (CSV)Vote-share ladders today (CSV)2024 Senate minor candidates (CSV)
Today’s ladders (one row per rung) and the Clerk’s 2024 minor-candidate shares. No price histories are included. Free to reuse under CC BY 4.0 with a link back to this page.
Embed this chart
Methodology
- Markets. Every open Kalshi
KXMIDTERMMOVandKXVOTEGENERALcontract, read from the public API with full paging. - Prices. Bid/ask midpoint, only for rungs with a two-sided quote no wider than 10¢. Ladders are forced to fall as the threshold rises before we read the middle.
- Certified results. The Clerk of the House’s “Statistics of the Congressional Election” for 2020, 2022 and 2024. Shares use every candidate in the Clerk’s count for that race.
- Scoring. Daily snapshots are stored; scoring begins once each state certifies.
- Limits. Nothing has settled yet; these are today’s odds, not a track record. Thin rungs without a live quote are left out. Prior results are context, not a forecast: candidates, turnout and district lines change. Nothing here is investment advice. Last run: Oct 23, 2026, 8:37 AM ET.
Cite this research
Suggested citation: PredictionScout. (2026, October 23). Vote-Share and Margin-of-Victory Prediction Markets for 2026. https://predictionscout.com/research/vote-share-margin-prediction-markets/
For a chart or news story: “Source: PredictionScout analysis of public exchange data (https://predictionscout.com/research/vote-share-margin-prediction-markets/)”
The data and charts on this page are free to reuse under CC BY 4.0 with a link back to this page. Market data: Kalshi. Certified results: Clerk of the U.S. House of Representatives.
Data sources: prices and volumes come from the public APIs of Kalshi and Polymarket, with certified results from the Clerk of the House. All trademarks belong to their owners. PredictionScout is independent and not affiliated with any exchange. Nothing here is investment, betting, or legal advice.
Related: House vote and seat markets · county election markets · All research