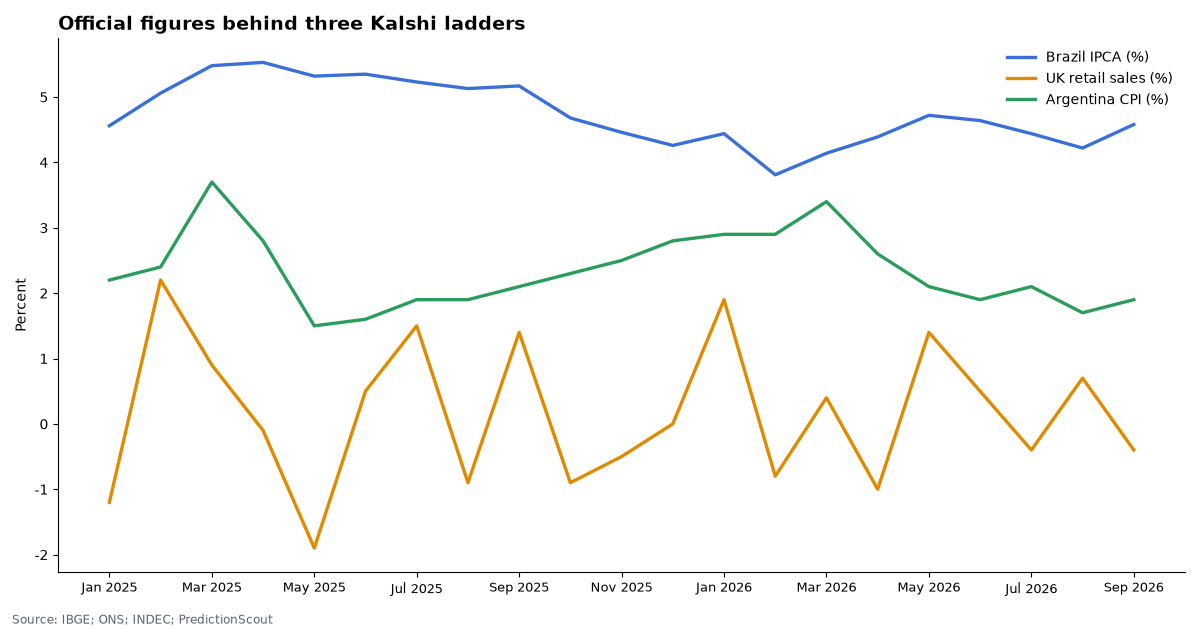
Across 21 settled months of Brazilian inflation, UK retail sales and Argentine inflation, the value Kalshi settled on equals the statistics office’s current figure in 14 of 21 months; all 7 differences are UK retail sales.
We pulled each figure from the agency that publishes it (IBGE, the ONS and INDEC) and compared it with the value Kalshi settled on and with the market’s implied median a day before. Contracts on the right side of 50¢ a day before: 140 of 158.
Kalshi market data and IBGE, ONS and INDEC statistics, pulled Oct 23, 2026, 10:41 AM ET. Updated daily.
By Arthur Angelo, PredictionScout Research · Updated Oct 23, 2026, 10:41 AM ET
Key findings
- Brazil IPCA. Over 6 months the median a day before missed the settled figure by a median 0.11 points; contracts on the favored side were right 43 of 47.
- UK retail sales. Over 8 months the median a day before missed the settled figure by a median 0.65 points; contracts on the favored side were right 49 of 60.
- Argentina CPI. Over 7 months the median a day before missed the settled figure by a median 0.10 points; contracts on the favored side were right 48 of 51.
- Settled value vs the agency today. 7 months differ: UK retail sales Mar 2026 settled 0.7%, ONS now shows 0.4%; UK retail sales Jul 2026 settled -0.5%, ONS now shows -0.4%; UK retail sales Jun 2026 settled 1%, ONS now shows 0.5%; UK retail sales May 2026 settled 1.2%, ONS now shows 1.4%; UK retail sales Feb 2026 settled -0.4%, ONS now shows -0.8%; UK retail sales Apr 2026 settled -1.3%, ONS now shows -1%; UK retail sales Aug 2026 settled 0.5%, ONS now shows 0.7%. Kalshi’s terms settle on the first published figure and ignore later revisions. The ONS revises retail sales as late returns arrive and seasonal factors are re-estimated, and we compute the monthly change from today’s index, so these gaps are consistent with revisions; we could not see each first-published figure to confirm it.
- Biggest surprise. UK retail sales for Mar 2026: the market’s median a day before was -0.71%, and the figure came in at 0.7%.
- Source labels. On Kalshi’s series pages, the UK retail and Argentina CPI markets list U.S. Bureau of Labor Statistics releases as their source; the contracts’ own terms point to the relevant statistics office. We checked against the office.
- Next: Brazil IPCA for Oct 2026 (trading closes Nov 12, 2026): implied median 4.77%.
- Next: UK retail sales for Oct 2026 (trading closes Nov 20, 2026): implied median -1.50%.
- Next: Argentina CPI for Oct 2026 (trading closes Nov 12, 2026): implied median 1.86%.
- Kalshi lists unemployment-rate ladders for 8 economies; all settle on Trading Economics’ copy of the national statistics office’s headline figure (global unemployment).
Every settled month
The median is read from Kalshi’s “above X” ladder 24 hours before trading closed. “Agency today” is the figure in the statistics office’s database now, after any revisions.
| Series | Month | Kalshi median, 24h before | Kalshi settled | Agency today | Favored side right |
|---|---|---|---|---|---|
| Argentina CPI | Mar 2026 | 3.17% | 3.4% | 3.4% | 6/6 |
| Argentina CPI | Apr 2026 | 2.66% | 2.6% | 2.6% | 8/9 |
| Argentina CPI | May 2026 | 2.30% | 2.1% | 2.1% | 8/9 |
| Argentina CPI | Jun 2026 | 1.87% | 1.9% | 1.9% | 7/7 |
| Argentina CPI | Jul 2026 | 1.88% | 2.1% | 2.1% | 8/9 |
| Argentina CPI | Aug 2026 | 1.63% | 1.7% | 1.7% | 9/9 |
| Argentina CPI | Sep 2026 | 1.80% | 1.9% | 1.9% | 2/2 |
| Brazil IPCA | Apr 2026 | 4.35% | 4.39% | 4.39% | 4/4 |
| Brazil IPCA | May 2026 | 4.60% | 4.72% | 4.72% | 9/9 |
| Brazil IPCA | Jun 2026 | 4.81% | 4.64% | 4.64% | 9/11 |
| Brazil IPCA | Jul 2026 | 4.40% | 4.44% | 4.44% | 5/6 |
| Brazil IPCA | Aug 2026 | 4.32% | 4.22% | 4.22% | 7/8 |
| Brazil IPCA | Sep 2026 | 4.40% | 4.58% | 4.58% | 9/9 |
| UK retail sales | Feb 2026 | -1.00% | -0.4% | -0.8% | 6/8 |
| UK retail sales | Mar 2026 | -0.71% | 0.7% | 0.4% | 5/8 |
| UK retail sales | Apr 2026 | -0.23% | -1.3% | -1% | 6/8 |
| UK retail sales | May 2026 | 0.50% | 1.2% | 1.4% | 6/7 |
| UK retail sales | Jun 2026 | -0.20% | 1% | 0.5% | 4/6 |
| UK retail sales | Jul 2026 | -0.20% | -0.5% | -0.4% | 7/7 |
| UK retail sales | Aug 2026 | 0.11% | 0.5% | 0.7% | 8/8 |
| UK retail sales | Sep 2026 | 0.04% | -0.4% | -0.4% | 7/8 |
Brazil inflation (IPCA, 12-month): live ladder
| Above | Chance now | Volume |
|---|---|---|
| 3.9% | 98% | 1,462 |
| 4% | 97% | 400 |
| 4.1% | 97% | 200 |
| 4.2% | 97% | 200 |
| 4.3% | 97% | 350 |
| 4.4% | 97% | 900 |
| 4.5% | 96% | 1,008 |
| 4.6% | 70% | 412 |
| 4.7% | 66% | 3,212 |
| 4.8% | 42% | 1,210 |
| 4.9% | 24% | 30 |
UK retail sales volume (month on month): live ladder
| Above | Chance now | Volume |
|---|---|---|
| -1.5% | 0% | 0 |
| -1% | 0% | 0 |
| -0.5% | 0% | 0 |
| 0% | 0% | 0 |
| 0.5% | 0% | 0 |
| 1% | 0% | 0 |
| 1.5% | 0% | 0 |
| 2% | 0% | 0 |
Argentina inflation (CPI, month on month): live ladder
| Above | Chance now | Volume |
|---|---|---|
| 1% | 100% | 106 |
| 1.2% | 97% | 56 |
| 1.4% | 94% | 566 |
| 1.6% | 80% | 604 |
| 1.8% | 59% | 979 |
| 2% | 26% | 124 |
| 2.2% | 6% | 644 |
| 2.4% | 2% | 1,000 |
| 2.6% | 3% | 0 |
Global unemployment rate markets
Kalshi lists a monthly unemployment ladder for several large economies under the KXUE series. Each contract asks whether the headline rate will be above a threshold, such as “above 6.4%”. All of them settle on the rate shown by Trading Economics. Trading Economics republishes the national statistics office’s headline figure, so the number to watch is the agency’s own release, listed in the table.
How it settles. The market takes the headline rate exactly as published, usually to one decimal place. A contract for “above 4.7%” resolves No on a print of exactly 4.7%. Later revisions do not change the result.
What moves it. Survey sampling noise of 0.1 to 0.2 points is common in monthly labor surveys, and so are swings in the participation rate (a falling share of people looking for work can push the rate down even when hiring is weak). Seasonal hiring and, in Brazil, the overlapping three-month window move it too.
Worked example. Suppose the Australian Bureau of Statistics reports seasonally adjusted unemployment of 4.718% in its detailed tables. The headline is rounded to 4.7%, so “above 4.6%” resolves Yes and “above 4.7%” resolves No. A trader paying 77¢ for “above 4.6%” would collect $1.00 per contract.
| Country | Period | Closes | Market middle | Ladder (chance above) | Official source | Contracts traded |
|---|---|---|---|---|---|---|
| Russia | September 2026 | 2026-10-28 | prices out of order | >2%: 0% · >2.1%: 81% · >2.2%: 85% · >2.3%: 23% · >2.4%: 0% · >2.5%: 1% | Rosstat | 5,840 |
| Brazil | September 2026 | 2026-10-30 | prices out of order | >4.9%: 0% · >5%: 0% · >5.1%: 90% · >5.2%: 39% · >5.3%: 2% · >5.4%: 1% | IBGE (PNAD Contínua, rolling three-month) | 1,642 |
| Germany | October 2026 | 2026-10-30 | 6.4% | >6.1%: 97% · >6.2%: 96% · >6.3%: 83% · >6.4%: 26% · >6.5%: 15% · >6.6%: 4% | Federal Employment Agency (registered unemployment) | 1,144 |
| Canada | October 2026 | 2026-11-06 | 6.45% | >6.2%: 94% · >6.3%: 87% · >6.4%: 60% · >6.5%: 42% · >6.6%: 22% · >6.7%: 9% | Statistics Canada (Labour Force Survey) | 4,534 |
| South Africa | Q3 2026 | 2026-11-10 | prices out of order | >31%: 98% · >31.5%: 92% · >32%: 74% · >32.5%: 55% · >33%: 35% · >33.5%: 16% | Stats SA (Quarterly Labour Force Survey) | 18,658 |
| China | October 2026 | 2026-11-16 | 5.1% | >4.8%: 98% · >4.9%: 98% · >5%: 92% · >5.1%: 46% · >5.2%: 12% · >5.3%: 4% | National Bureau of Statistics (urban surveyed rate) | 9,711 |
| Australia | October 2026 | 2026-11-19 | thin trading | >4.3%: 97% · >4.4%: 96% · >4.5%: 93% · >4.6%: 77% · >4.7%: 0% · >4.8%: 0% | Australian Bureau of Statistics (Labour Force, Australia) | 11 |
| Mexico | October 2026 | 2026-11-26 | prices out of order | >2.6%: 50% · >2.7%: 60% · >2.8%: 45% · >2.9%: 24% · >3%: 45% · >3.1%: 6% | INEGI (ENOE) | 6,607 |
Market middle: for “above X” ladders, the point where the implied chance crosses 50% (prices forced to fall as the threshold rises, interpolated between rungs). Prices are the bid/ask midpoint when the spread is 10¢ or less, otherwise the last trade. Events with fewer than 500 contracts traded show “thin trading” instead of a middle, and ladders whose quoted prices contradict each other show “prices out of order”. Pulled Oct 23, 2026, 10:41 AM ET.
Download the data
Settled months vs the statistics office (CSV)Official monthly figures since 2025 (CSV)Global unemployment rate ladders (live) (CSV)
One row per settled month with the market median and both values, plus the three official series. No price histories are included. Free to reuse under CC BY 4.0 with a link back to this page.
Embed this chart
Methodology
- Brazil IPCA. IBGE SIDRA table 1737; Kalshi series
KXBRAZILINF. - UK retail sales. ONS series J5EK (month-on-month change computed from the seasonally adjusted volume index, rounded to one decimal as the ONS publishes it); Kalshi series
KXUKRETAIL. - Argentina CPI. INDEC national CPI; Kalshi series
KXARMOMINF. - Market median. Each settled “above X” contract priced from hourly candles 24 hours before trading closed (bid/ask midpoint, or last trade when the spread is wider than 10¢), forced to fall as X rises, and read at 50%.
- Matching periods. Each Kalshi event is matched to the reference month named in its contract, not the release date.
- Limits. Kalshi has listed these ladders only since 2026, so each series has a handful of months. Agency figures can be revised; we compare with today’s vintage and cannot see every first-published value. South Korea’s export market is not included because we found no keyless official data feed to check it against. Nothing here is investment advice. Last run: Oct 23, 2026, 10:41 AM ET.
Cite this research
Suggested citation: PredictionScout. (2026, October 23). International Economic Data Prediction Markets vs Official Statistics. https://predictionscout.com/research/international-economic-data-prediction-markets/
For a chart or news story: “Source: PredictionScout analysis of public exchange data (https://predictionscout.com/research/international-economic-data-prediction-markets/)”
The data and charts on this page are free to reuse under CC BY 4.0 with a link back to this page. Market data: Kalshi. Statistics: IBGE (Brazil), Office for National Statistics (UK, Open Government Licence), INDEC (Argentina).
Data sources: prices and volumes come from the public APIs of Kalshi and Polymarket, with official figures from IBGE, the ONS and INDEC. All trademarks belong to their owners. PredictionScout is independent and not affiliated with any exchange. Nothing here is investment, betting, or legal advice.
Related: international election markets · FOMC dissent markets · All research