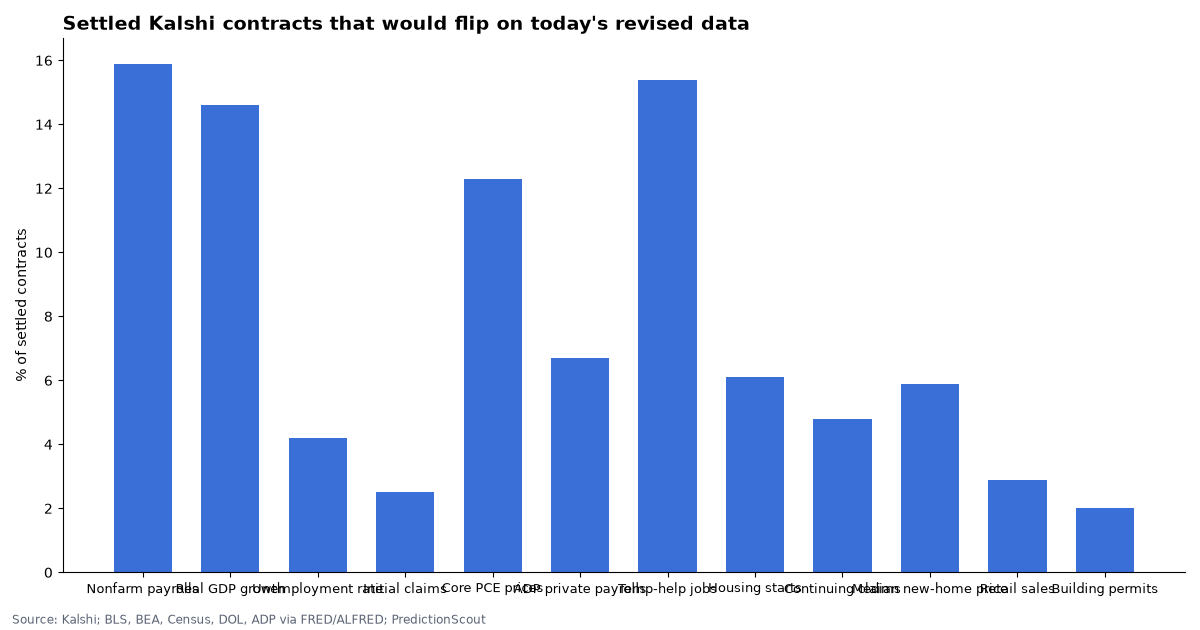
136 of 1,855 settled Kalshi contracts would pay out the other way on today’s revised numbers.
Kalshi settles economic-data markets on the first number an agency publishes, and agencies revise. We took 218 scored releases across 12 series, looked up the same period in today’s official data, and re-checked every “above X” contract. 158 of the 218 first prints have since been revised; 89 releases have at least one contract that would now settle differently.
Kalshi market data and current FRED data, pulled Oct 23, 2026, 8:38 AM ET. Updated daily.
By Arthur Angelo, PredictionScout Research · Updated Oct 23, 2026, 8:38 AM ET
Key findings
- 136 of 1,855 contracts (7.3%) would flip if they were settled on the current official value instead of the first print. They come from 89 of 218 releases.
- Nonfarm payrolls (monthly change): 58 of 365 contracts in 28 of 40 releases would flip; the typical revision is 67K (39 of 40 first prints revised).
- Temporary help services jobs: 4 of 26 contracts in 3 of 5 releases would flip; the typical revision is 7.5K (4 of 5 first prints revised).
- Real GDP growth (advance estimate): 18 of 123 contracts in 9 of 13 releases would flip; the typical revision is 0.4 pt (13 of 13 first prints revised).
- Most recent revised jobs report: Aug 2026 payrolls settled on the first print of +162K; BLS’s current figure is +133K, so 1 of 19 contracts would now pay the other way.
- This is not an error in settlement. Kalshi’s rules say these markets settle on the first published value, and the scorecards on this site verify that they did. The point is how much of a market’s outcome depends on which vintage of the data counts.
Series by series
“Typical revision” is the median absolute difference between the first print Kalshi settled on and the value in today’s official data, across every scored release (unrevised releases count as zero). Each link goes to that series’ full scorecard.
| Series | Releases scored | First prints revised | Typical revision | Contracts | Would flip today | Releases with a flip | Since |
|---|---|---|---|---|---|---|---|
| Nonfarm payrolls (monthly change) | 40 | 39 | 67K | 365 | 58 | 28 | Apr 7, 2023 |
| Temporary help services jobs | 5 | 4 | 7.5K | 26 | 4 | 3 | Jun 5, 2026 |
| Real GDP growth (advance estimate) | 13 | 13 | 0.4 pt | 123 | 18 | 9 | Jan 26, 2023 |
| Core PCE prices (monthly change) | 16 | 7 | 0.0 pt | 73 | 9 | 7 | Dec 20, 2024 |
| ADP private payrolls (monthly change) | 17 | 14 | 4K | 120 | 8 | 6 | Apr 2, 2025 |
| Housing starts (annual rate) | 6 | 6 | 20K | 49 | 3 | 2 | Apr 29, 2026 |
| Median new-home price | 3 | 2 | $1,600 | 34 | 2 | 1 | Jul 24, 2026 |
| Continuing jobless claims (weekly) | 7 | 6 | 7K | 63 | 3 | 3 | Aug 27, 2026 |
| Unemployment rate | 43 | 12 | 0.0 pt | 360 | 15 | 15 | Jan 6, 2023 |
| Retail sales (monthly change) | 8 | 5 | 0.1 pt | 69 | 2 | 1 | Apr 1, 2026 |
| Initial jobless claims (weekly) | 53 | 44 | 1K | 524 | 13 | 13 | Jun 12, 2025 |
| Building permits (annual rate) | 7 | 6 | 9K | 49 | 1 | 1 | Apr 29, 2026 |
Every release that would settle differently
Newest first. “Yes → No” means the contract paid Yes on the first print but the revised number is at or below the threshold.
| Series | Period | Settled on (first print) | Current official value | Revision | Contracts that would flip |
|---|---|---|---|---|---|
| Initial jobless claims (weekly) | wk of Oct 10, 2026 | 199K | 200K | +1K | 1 of 10: above 200K (No → Yes) |
| Continuing jobless claims (weekly) | wk of Sep 19, 2026 | 1,701K | 1,699K | -2K | 1 of 11: above 1,700K (Yes → No) |
| Continuing jobless claims (weekly) | wk of Sep 5, 2026 | 1,730K | 1,717K | -13K | 1 of 10: above 1,730K (Yes → No) |
| Building permits (annual rate) | Aug 2026 | 1,394K | 1,403K | +9K | 1 of 7: above 1,400K (No → Yes) |
| Continuing jobless claims (weekly) | wk of Aug 29, 2026 | 1,774K | 1,765K | -9K | 1 of 6: above 1,770K (Yes → No) |
| Nonfarm payrolls (monthly change) | Aug 2026 | +162K | +133K | -29K | 1 of 19: above 150K (Yes → No) |
| Temporary help services jobs | Aug 2026 | 2,519.5K | 2,497.7K | -21.8K | 2 of 6: above 2,500.0K (Yes → No), above 2,510.0K (Yes → No) |
| Core PCE prices (monthly change) | Jul 2026 | 0.2% | 0.1% | -0.1 pt | 1 of 5: above 0.1% (Yes → No) |
| Housing starts (annual rate) | Jul 2026 | 1,239K | 1,369K | +130K | 1 of 9: above 1,360K (No → Yes) |
| Initial jobless claims (weekly) | wk of Aug 8, 2026 | 209K | 212K | +3K | 1 of 11: above 210K (No → Yes) |
| Temporary help services jobs | Jul 2026 | 2,505.0K | 2,497.5K | -7.5K | 1 of 5: above 2,500.0K (Yes → No) |
| Initial jobless claims (weekly) | wk of Aug 1, 2026 | 199K | 200K | +1K | 1 of 9: above 200K (No → Yes) |
| Real GDP growth (advance estimate) | Q2 2026 | 1.5% | 2.2% | +0.7 pt | 2 of 9: above 1.5% (No → Yes), above 2.0% (No → Yes) |
| Median new-home price | Jun 2026 | $398,300 | $406,400 | +$8,100 | 2 of 11: above $400,000 (No → Yes), above $405,000 (No → Yes) |
| Nonfarm payrolls (monthly change) | Jun 2026 | +57K | +31K | -26K | 2 of 15: above 40K (Yes → No), above 50K (Yes → No) |
| Initial jobless claims (weekly) | wk of Jun 6, 2026 | 229K | 230K | +1K | 1 of 10: above 230K (No → Yes) |
| Nonfarm payrolls (monthly change) | May 2026 | +172K | +63K | -109K | 7 of 17: above 70K (Yes → No), above 80K (Yes → No), above 90K (Yes → No), above 100K (Yes → No) … |
| Temporary help services jobs | May 2026 | 2,490.0K | 2,490.6K | +0.6K | 1 of 5: above 2,490.0K (No → Yes) |
| Initial jobless claims (weekly) | wk of May 23, 2026 | 215K | 212K | -3K | 1 of 10: above 215K (Yes → No) |
| Core PCE prices (monthly change) | Apr 2026 | 0.2% | 0.3% | +0.1 pt | 1 of 4: above 0.2% (No → Yes) |
| Initial jobless claims (weekly) | wk of May 16, 2026 | 209K | 210K | +1K | 1 of 10: above 210K (No → Yes) |
| Housing starts (annual rate) | Apr 2026 | 1,465K | 1,414K | -51K | 2 of 8: above 1,425K (Yes → No), above 1,450K (Yes → No) |
| Nonfarm payrolls (monthly change) | Apr 2026 | +115K | +148K | +33K | 1 of 19: above 125K (No → Yes) |
| Initial jobless claims (weekly) | wk of May 2, 2026 | 200K | 199K | -1K | 1 of 10: above 200K (Yes → No) |
| Initial jobless claims (weekly) | wk of Apr 25, 2026 | 189K | 190K | +1K | 1 of 10: above 190K (No → Yes) |
| Real GDP growth (advance estimate) | Q1 2026 | 2.0% | 2.5% | +0.5 pt | 1 of 8: above 2.0% (No → Yes) |
| Initial jobless claims (weekly) | wk of Apr 18, 2026 | 214K | 215K | +1K | 1 of 10: above 215K (No → Yes) |
| Core PCE prices (monthly change) | Feb 2026 | 0.4% | 0.3% | -0.1 pt | 1 of 6: above 0.3% (Yes → No) |
| Retail sales (monthly change) | Feb 2026 | +0.6% | +0.9% | +0.3 pt | 2 of 8: above 0.6% (No → Yes), above 0.8% (No → Yes) |
| Real GDP growth (advance estimate) | Q4 2025 | 1.4% | 0.2% | -1.2 pt | 3 of 16: above 0.5% (Yes → No), above 1.0% (Yes → No), above 1.2% (Yes → No) |
| Initial jobless claims (weekly) | wk of Feb 7, 2026 | 227K | 230K | +3K | 1 of 10: above 230K (No → Yes) |
| Initial jobless claims (weekly) | wk of Jan 24, 2026 | 209K | 211K | +2K | 1 of 10: above 210K (No → Yes) |
| Nonfarm payrolls (monthly change) | Dec 2025 | +50K | -17K | -67K | 5 of 13: above 0K (Yes → No), above 10K (Yes → No), above 20K (Yes → No), above 30K (Yes → No) … |
| Initial jobless claims (weekly) | wk of Dec 20, 2025 | 214K | 215K | +1K | 1 of 10: above 215K (No → Yes) |
| Nonfarm payrolls (monthly change) | Nov 2025 | +64K | +41K | -23K | 1 of 10: above 50K (Yes → No) |
| Unemployment rate | Nov 2025 | 4.6% | 4.5% | -0.1 pt | 1 of 10: above 4.5% (Yes → No) |
| ADP private payrolls (monthly change) | Oct 2025 | +42K | +20K | -22K | 1 of 7: above 25K (Yes → No) |
| Nonfarm payrolls (monthly change) | Aug 2025 | +22K | -70K | -92K | 1 of 10: above 0K (Yes → No) |
| ADP private payrolls (monthly change) | Aug 2025 | +54K | +49K | -5K | 1 of 10: above 50K (Yes → No) |
| Core PCE prices (monthly change) | Jul 2025 | 0.3% | 0.2% | -0.1 pt | 1 of 5: above 0.2% (Yes → No) |
| Initial jobless claims (weekly) | wk of Aug 16, 2025 | 235K | 233K | -2K | 1 of 10: above 235K (Yes → No) |
| Unemployment rate | Jul 2025 | 4.2% | 4.3% | +0.1 pt | 1 of 6: above 4.2% (No → Yes) |
| ADP private payrolls (monthly change) | Jul 2025 | +104K | +77K | -27K | 1 of 6: above 100K (Yes → No) |
| Real GDP growth (advance estimate) | Q2 2025 | 3.0% | 4.0% | +1.0 pt | 2 of 14: above 3.0% (No → Yes), above 3.5% (No → Yes) |
| Nonfarm payrolls (monthly change) | Jun 2025 | +147K | -20K | -167K | 2 of 7: above 0K (Yes → No), above 100K (Yes → No) |
| Nonfarm payrolls (monthly change) | May 2025 | +139K | +13K | -126K | 1 of 7: above 100K (Yes → No) |
| Unemployment rate | May 2025 | 4.2% | 4.3% | +0.1 pt | 1 of 8: above 4.2% (No → Yes) |
| ADP private payrolls (monthly change) | May 2025 | +37K | -24K | -61K | 1 of 7: above 0K (Yes → No) |
| Core PCE prices (monthly change) | Apr 2025 | 0.1% | 0.3% | +0.2 pt | 2 of 5: above 0.1% (No → Yes), above 0.2% (No → Yes) |
| Nonfarm payrolls (monthly change) | Apr 2025 | +177K | +108K | -69K | 1 of 7: above 150K (Yes → No) |
| ADP private payrolls (monthly change) | Apr 2025 | +62K | -23K | -85K | 1 of 7: above 0K (Yes → No) |
| Real GDP growth (advance estimate) | Q1 2025 | -0.3% | 0.1% | +0.4 pt | 1 of 10: above 0.0% (No → Yes) |
| Nonfarm payrolls (monthly change) | Mar 2025 | +228K | +67K | -161K | 3 of 6: above 100K (Yes → No), above 150K (Yes → No), above 200K (Yes → No) |
| ADP private payrolls (monthly change) | Mar 2025 | +155K | -53K | -208K | 3 of 7: above 0K (Yes → No), above 100K (Yes → No), above 150K (Yes → No) |
| Core PCE prices (monthly change) | Feb 2025 | 0.4% | 0.3% | -0.1 pt | 1 of 2: above 0.3% (Yes → No) |
| Nonfarm payrolls (monthly change) | Feb 2025 | +151K | +42K | -109K | 2 of 7: above 100K (Yes → No), above 150K (Yes → No) |
| Unemployment rate | Feb 2025 | 4.1% | 4.2% | +0.1 pt | 1 of 6: above 4.1% (No → Yes) |
| Nonfarm payrolls (monthly change) | Dec 2024 | +256K | +237K | -19K | 1 of 7: above 250K (Yes → No) |
| Unemployment rate | Dec 2024 | 4.1% | 4.1% | 0.0 pt | 1 of 5: above 4.1% (No → Yes) |
| Core PCE prices (monthly change) | Nov 2024 | 0.3% | 0.1% | -0.2 pt | 2 of 4: above 0.1% (Yes → No), above 0.2% (Yes → No) |
| Nonfarm payrolls (monthly change) | Nov 2024 | +227K | +134K | -93K | 2 of 9: above 150K (Yes → No), above 200K (Yes → No) |
| Unemployment rate | Oct 2024 | 4.1% | 4.1% | 0.0 pt | 1 of 5: above 4.1% (No → Yes) |
| Real GDP growth (advance estimate) | Q3 2024 | 2.8% | 3.2% | +0.4 pt | 2 of 7: above 2.8% (No → Yes), above 2.9% (No → Yes) |
| Nonfarm payrolls (monthly change) | Sep 2024 | +254K | +155K | -99K | 2 of 8: above 200K (Yes → No), above 250K (Yes → No) |
| Unemployment rate | Sep 2024 | 4.1% | 4.1% | 0.0 pt | 1 of 7: above 4.1% (No → Yes) |
| Nonfarm payrolls (monthly change) | Aug 2024 | +142K | +9K | -133K | 1 of 7: above 100K (Yes → No) |
| Nonfarm payrolls (monthly change) | Jul 2024 | +114K | +53K | -61K | 1 of 8: above 100K (Yes → No) |
| Unemployment rate | Jul 2024 | 4.3% | 4.2% | -0.1 pt | 1 of 9: above 4.2% (Yes → No) |
| Real GDP growth (advance estimate) | Q2 2024 | 2.8% | 3.6% | +0.8 pt | 2 of 8: above 2.9% (No → Yes), above 3.4% (No → Yes) |
| Nonfarm payrolls (monthly change) | Jun 2024 | +206K | +87K | -119K | 3 of 8: above 100K (Yes → No), above 150K (Yes → No), above 200K (Yes → No) |
| Unemployment rate | Jun 2024 | 4.1% | 4.1% | 0.0 pt | 1 of 10: above 4.1% (No → Yes) |
| Nonfarm payrolls (monthly change) | May 2024 | +272K | +78K | -194K | 5 of 8: above 100K (Yes → No), above 150K (Yes → No), above 175K (Yes → No), above 200K (Yes → No) … |
| Unemployment rate | May 2024 | 4.0% | 3.9% | -0.1 pt | 1 of 8: above 3.9% (Yes → No) |
| Nonfarm payrolls (monthly change) | Apr 2024 | +175K | +64K | -111K | 2 of 10: above 100K (Yes → No), above 150K (Yes → No) |
| Nonfarm payrolls (monthly change) | Mar 2024 | +303K | +228K | -75K | 3 of 9: above 250K (Yes → No), above 275K (Yes → No), above 300K (Yes → No) |
| Unemployment rate | Mar 2024 | 3.8% | 3.9% | +0.1 pt | 1 of 9: above 3.8% (No → Yes) |
| Nonfarm payrolls (monthly change) | Jan 2024 | +353K | +175K | -178K | 3 of 7: above 200K (Yes → No), above 216K (Yes → No), above 300K (Yes → No) |
| Real GDP growth (advance estimate) | Q4 2023 | 3.3% | 3.6% | +0.3 pt | 1 of 9: above 3.4% (No → Yes) |
| Nonfarm payrolls (monthly change) | Dec 2023 | +216K | +154K | -62K | 1 of 3: above 199K (Yes → No) |
| Unemployment rate | Dec 2023 | 3.7% | 3.8% | +0.1 pt | 1 of 11: above 3.7% (No → Yes) |
| Nonfarm payrolls (monthly change) | Nov 2023 | +199K | +127K | -72K | 1 of 6: above 150K (Yes → No) |
| Nonfarm payrolls (monthly change) | Sep 2023 | +336K | +156K | -180K | 2 of 6: above 200K (Yes → No), above 300K (Yes → No) |
| Unemployment rate | Sep 2023 | 3.8% | 3.7% | -0.1 pt | 1 of 6: above 3.7% (Yes → No) |
| Nonfarm payrolls (monthly change) | Aug 2023 | +187K | +218K | +31K | 1 of 6: above 200K (No → Yes) |
| Unemployment rate | Aug 2023 | 3.8% | 3.7% | -0.1 pt | 1 of 6: above 3.7% (Yes → No) |
| Nonfarm payrolls (monthly change) | May 2023 | +339K | +280K | -59K | 1 of 5: above 300K (Yes → No) |
| Unemployment rate | May 2023 | 3.7% | 3.6% | -0.1 pt | 1 of 5: above 3.6% (Yes → No) |
| Real GDP growth (advance estimate) | Q1 2023 | 1.1% | 3.4% | +2.3 pt | 4 of 7: above 1.4% (No → Yes), above 1.9% (No → Yes), above 2.4% (No → Yes), above 2.9% (No → Yes) |
| Nonfarm payrolls (monthly change) | Mar 2023 | +236K | +68K | -168K | 2 of 6: above 100K (Yes → No), above 200K (Yes → No) |
Download the data
Release-by-release revisions (CSV)
One row per scored release: first print, current value, revision and flipped thresholds. No prices are included. Free to reuse under CC BY 4.0 with a link back to this page.
Embed this chart
Methodology
- Markets. Every settled Kalshi threshold ladder scored on our economic scorecards:
KXPAYROLLS,KXADP,KXU3,KXJOBLESSCLAIMS,KXCONTCLAIMS,KXTEMPHELP,KXGDP,KXUSRETAIL,KXPCECORE,KXHOUSINGSTART,KXBUILDPERMS,KXUSHOME. Each event’s contracts and results come from Kalshi’s public API; the contracts counted are the ones that had a price 24 hours before close (the same set the scorecards use). - First print. The value Kalshi settled on. The scorecards check it against the first-published value in ALFRED; the period is matched through ALFRED’s first-release dates.
- Current value. The same period in the latest FRED vintage (series A191RL1Q225SBEA, ADPMNUSNERSA, CCSA, HOUST, ICSA, MSPNHSUS, PAYEMS, PCEPILFE, PERMIT, RSAFS, TEMPHELPS, UNRATE), pulled on each run, converted to Kalshi’s units and rounded the way the agency publishes it (payrolls, ADP and claims to the nearest thousand, rates and percent changes to 0.1, housing to the nearest thousand units, home prices to $100). Monthly changes are recomputed from current levels.
- Would flip. A contract flips if the current value lands on the other side of its threshold (“above” or “at least”, as each series defines it).
- Limits. Covers only the ladders our scorecards price; FRED’s current vintage can differ from an agency’s website for a few hours after a release; rounding follows each agency’s headline convention, and a value exactly at a threshold depends on it. Nothing here is investment advice. Last run: Oct 23, 2026, 8:38 AM ET.
Cite this research
Suggested citation: PredictionScout. (2026, October 23). Would Prediction Markets Settle the Same Way Today? Kalshi Settlements vs Revised Economic Data. https://predictionscout.com/research/prediction-market-settlement-revisions/
For a chart or news story: “Source: PredictionScout analysis of public exchange data (https://predictionscout.com/research/prediction-market-settlement-revisions/)”
The data and charts on this page are free to reuse under CC BY 4.0 with a link back to this page. Market data: Kalshi. Economic data: BLS, BEA, Census Bureau, Department of Labor and ADP via FRED and ALFRED (Federal Reserve Bank of St. Louis).
Data sources: prices and volumes come from the public APIs of Kalshi and Polymarket, with economic data from FRED and ALFRED. All trademarks belong to their owners. PredictionScout is independent and not affiliated with any exchange. Nothing here is investment, betting, or legal advice.
Related: jobs report scorecard · GDP scorecard · markets vs official numbers · All research