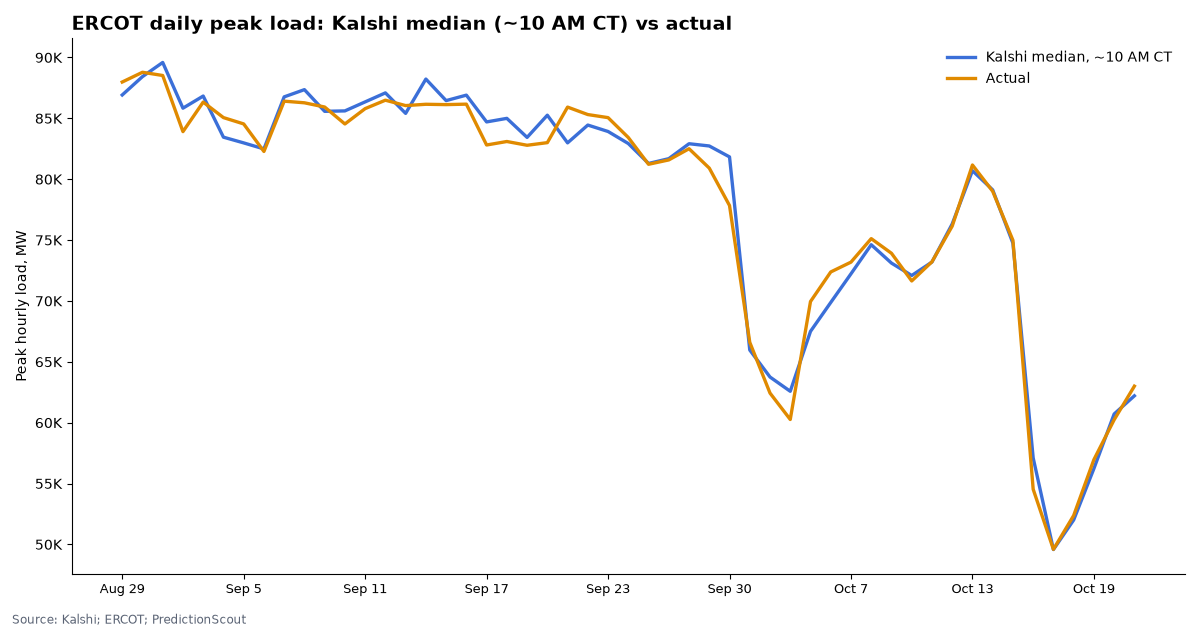
On the morning of each day, Kalshi’s ERCOT peak-demand markets missed the Texas grid’s actual daily peak by a median 736 MW.
That is about 1.0% of a typical daily peak in our ERCOT archive. We scored 51 days from Aug 30, 2026, comparing each market’s median at about 10 AM Central (14 hours before trading closed, before the usual afternoon peak) with the highest hourly load in ERCOT’s official report. The actual peak came in above the market median on 23 days and below it on 28.
Kalshi market data and official statistics, pulled Oct 23, 2026, 8:32 AM ET. Updated daily.
By Arthur Angelo, PredictionScout Research · Updated Oct 23, 2026, 8:32 AM ET
Key findings
- Typical miss 736 MW (average 1,030 MW) over 51 days.
- Threshold contracts right 91% of the time (578 of 635 “above X MW” contracts).
- Market vs. “same as yesterday.” On the 34 days where we have ERCOT’s previous-day peak, the market’s median miss was 740 MW against 2,274 MW for simply repeating yesterday’s peak; the market was closer on 21 of 34 days.
- Biggest miss: Sep 30. Market median 81,833 MW, actual peak 77,838 MW.
- Highest peak in our ERCOT archive: 86,168 MW on Sep 16, 2026 (hour ending 17:00 CT).
- Settlement check. 35 of 35 days with an ERCOT report on file match Kalshi’s settlement value. Kalshi sometimes shows its settlement rounded to the whole megawatt; differences under 1 MW count as a match. ERCOT keeps only about 30 days of this report online, so earlier days rely on Kalshi’s settlement value.
ERCOT daily peak load
Live market: Texas ERCOT peak electricity demand on Oct 23, 2026
Trading closes Saturday, October 24, 2026, 12:55 AM ET. Market median right now: 64,139 MW. 408 contracts traded so far. As of Oct 23, 2026, 8:32 AM ET. Market on Kalshi.
| Contract | Implied chance |
|---|---|
| Above 61,000 MW | 98% |
| Above 61,500 MW | 97% |
| Above 62,000 MW | 95% |
| Above 62,500 MW | 96% |
| Above 63,000 MW | 82% |
| Above 63,500 MW | 76% |
| Above 64,000 MW | 55% |
| Above 64,500 MW | 37% |
| Above 65,000 MW | 19% |
| Above 66,500 MW | 7% |
| Above 67,000 MW | 4% |
| Above 67,500 MW | 3% |
| Above 68,000 MW | 3% |
| Above 68,500 MW | 2% |
| Above 69,000 MW | 2% |
| Above 69,500 MW | 2% |
| Above 70,000 MW | 2% |
Across 51 days from Aug 30, 2026 to Oct 22, 2026, the market’s median on the morning of the day was off by 736 MW on a typical day (median miss) and 1,030 MW on average. The number came in above the market median 23 times and below it 28 times. Of 635 individual “above X” contracts, the side priced above 50¢ that morning was right 578 times (91%).
| Period | Operating day ends | Market median ~10 AM CT | Actual (Kalshi settlement) | ERCOT report | Actual minus median | Contracts called right | Contracts traded |
|---|---|---|---|---|---|---|---|
| Oct 21 | Oct 22, 2026 | 62,206 MW | 63,001 MW | 63,001 MW ✓ | +795 MW | 14/16 | 26,828 |
| Oct 20 | Oct 21, 2026 | 60,712 MW | 60,239 MW | 60,239 MW ✓ | -473 MW | 15/15 | 9,239 |
| Oct 19 | Oct 20, 2026 | 56,230 MW | 56,966 MW | 56,966 MW ✓ | +736 MW | 17/18 | 32,834 |
| Oct 18 | Oct 19, 2026 | 52,006 MW | 52,374 MW | 52,374 MW ✓ | +368 MW | 11/11 | 16,500 |
| Oct 17 | Oct 18, 2026 | 49,580 MW | 49,594 MW | 49,594 MW ✓ | +14 MW | 15/15 | 3,279 |
| Oct 16 | Oct 17, 2026 | 57,103 MW | 54,532 MW | 54,532 MW ✓ | -2,571 MW | 6/8 | 56,897 |
| Oct 15 | Oct 16, 2026 | 74,745 MW | 74,982 MW | 74,982 MW ✓ | +237 MW | 19/19 | 22,418 |
| Oct 14 | Oct 15, 2026 | 79,125 MW | 79,010 MW | 79,010 MW ✓ | -115 MW | 19/19 | 47,833 |
| Oct 13 | Oct 14, 2026 | 80,702 MW | 81,169 MW | 81,169 MW ✓ | +467 MW | 18/19 | 15,730 |
| Oct 12 | Oct 13, 2026 | 76,325 MW | 76,145 MW | 76,145 MW ✓ | -180 MW | 18/18 | 37,580 |
| Oct 11 | Oct 12, 2026 | 73,196 MW | 73,217 MW | 73,217 MW ✓ | +22 MW | 16/16 | 18,255 |
| Oct 10 | Oct 11, 2026 | 72,091 MW | 71,643 MW | 71,643 MW ✓ | -448 MW | 10/11 | 6,447 |
| Oct 9 | Oct 10, 2026 | 73,110 MW | 73,917 MW | 73,918 MW ✓ | +807 MW | 12/13 | 19,463 |
| Oct 8 | Oct 9, 2026 | 74,620 MW | 75,120 MW | 75,120 MW ✓ | +500 MW | 11/12 | 12,093 |
| Oct 7 | Oct 8, 2026 | 72,231 MW | 73,190 MW | 73,190 MW ✓ | +959 MW | 9/10 | 6,630 |
| Oct 6 | Oct 7, 2026 | 69,875 MW | 72,381 MW | 72,381 MW ✓ | +2,506 MW | 12/17 | 12,249 |
| Oct 5 | Oct 6, 2026 | 67,500 MW | 69,952 MW | 69,952 MW ✓ | +2,452 MW | 11/15 | 15,826 |
| Oct 4 | Oct 5, 2026 | 62,579 MW | 60,263 MW | 60,263 MW ✓ | -2,316 MW | 11/16 | 18,882 |
| Oct 3 | Oct 4, 2026 | 63,750 MW | 62,432 MW | 62,433 MW ✓ | -1,318 MW | 13/16 | 14,229 |
| Oct 2 | Oct 3, 2026 | 65,969 MW | 66,602 MW | 66,602 MW ✓ | +633 MW | 15/17 | 19,489 |
| Oct 1 | Oct 2, 2026 | 78,500 MW | 66,732 MW | 66,732 MW ✓ | market median outside listed strikes | 3/3 | 10,641 |
| Sep 30 | Oct 1, 2026 | 81,833 MW | 77,838 MW | 77,838 MW ✓ | -3,995 MW | 9/17 | 16,252 |
| Sep 29 | Sep 30, 2026 | 82,732 MW | 80,912 MW | 80,912 MW ✓ | -1,820 MW | 7/7 | 13,888 |
| Sep 28 | Sep 29, 2026 | 82,917 MW | 82,505 MW | 82,505 MW ✓ | -412 MW | 9/9 | 13,292 |
| Sep 27 | Sep 28, 2026 | 81,690 MW | 81,586 MW | 81,586 MW ✓ | -104 MW | 11/11 | 21,899 |
| Sep 26 | Sep 27, 2026 | 79,500 MW | 78,488 MW | 78,488 MW ✓ | market median outside listed strikes | 14/14 | 17,099 |
| Sep 25 | Sep 26, 2026 | 81,294 MW | 81,227 MW | 81,227 MW ✓ | -67 MW | 16/16 | 25,651 |
| Sep 24 | Sep 25, 2026 | 82,932 MW | 83,427 MW | 83,427 MW ✓ | +495 MW | 15/16 | 33,717 |
| Sep 23 | Sep 24, 2026 | 83,921 MW | 85,060 MW | 85,060 MW ✓ | +1,139 MW | 14/15 | 38,597 |
| Sep 22 | Sep 23, 2026 | 84,449 MW | 85,312 MW | 85,312 MW ✓ | +862 MW | 8/8 | 27,577 |
| Sep 21 | Sep 22, 2026 | 82,988 MW | 85,926 MW | 85,926 MW ✓ | +2,938 MW | 8/9 | 66,450 |
| Sep 20 | Sep 21, 2026 | 85,260 MW | 83,005 MW | 83,005 MW ✓ | -2,255 MW | 6/6 | 19,274 |
| Sep 19 | Sep 20, 2026 | 83,437 MW | 82,790 MW | 82,790 MW ✓ | -647 MW | 7/8 | 2,319 |
| Sep 18 | Sep 19, 2026 | 85,000 MW | 83,099 MW | 83,099 MW ✓ | -1,901 MW | 10/11 | 14,547 |
| Sep 17 | Sep 18, 2026 | 84,708 MW | 82,812 MW | 82,812 MW ✓ | -1,896 MW | 10/12 | 30,649 |
| Sep 16 | Sep 17, 2026 | 86,907 MW | 86,168 MW | 86,168 MW ✓ | -740 MW | 12/13 | 16,544 |
| Sep 15 | Sep 16, 2026 | 86,458 MW | 86,129 MW | 86,129 MW ✓ | -329 MW | 13/13 | 20,579 |
| Sep 14 | Sep 15, 2026 | 88,228 MW | 86,157 MW | n/a | -2,071 MW | 10/12 | 30,784 |
| Sep 13 | Sep 14, 2026 | 85,410 MW | 86,050 MW | n/a | +640 MW | 11/12 | 77,244 |
| Sep 12 | Sep 13, 2026 | 87,093 MW | 86,492 MW | n/a | -601 MW | 10/11 | 38,087 |
| Sep 11 | Sep 12, 2026 | 86,353 MW | 85,800 MW | n/a | -553 MW | 11/12 | 78,939 |
| Sep 10 | Sep 11, 2026 | 85,613 MW | 84,539 MW | n/a | -1,074 MW | 9/10 | 86,634 |
| Sep 9 | Sep 10, 2026 | 85,578 MW | 85,932 MW | n/a | +354 MW | 11/11 | 43,199 |
| Sep 8 | Sep 9, 2026 | 87,359 MW | 86,279 MW | n/a | -1,081 MW | 11/12 | 48,234 |
| Sep 7 | Sep 8, 2026 | 86,765 MW | 86,412 MW | n/a | -352 MW | 9/9 | 37,624 |
| Sep 6 | Sep 7, 2026 | 82,490 MW | 82,280 MW | n/a | -210 MW | 8/8 | 41,966 |
| Sep 5 | Sep 6, 2026 | 82,985 MW | 84,543 MW | n/a | +1,558 MW | 5/5 | 45,587 |
| Sep 4 | Sep 5, 2026 | 83,455 MW | 85,063 MW | n/a | +1,608 MW | 8/10 | 75,320 |
| Sep 3 | Sep 4, 2026 | 83,000 MW | 81,772 MW | n/a | market median outside listed strikes | 0/2 | 86,200 |
| Sep 2 | Sep 3, 2026 | 86,833 MW | 86,336 MW | n/a | -497 MW | 12/12 | 32,953 |
| Sep 1 | Sep 2, 2026 | 85,837 MW | 83,910 MW | n/a | -1,927 MW | 10/12 | 37,904 |
| Aug 31 | Sep 1, 2026 | 89,592 MW | 88,522 MW | n/a | -1,071 MW | 11/12 | 42,774 |
| Aug 30 | Aug 31, 2026 | 88,429 MW | 88,787 MW | n/a | +358 MW | 12/12 | 34,087 |
| Aug 29 | Aug 30, 2026 | 86,921 MW | 87,985 MW | n/a | +1,064 MW | 3/3 | 65,799 |
Highlighted rows missed by more than 3,000 MW. Official values: ERCOT Actual System Load by Weather Zone (NP6-346-CD), highest hourly TOTAL for the operating day.
Download the data
One row per settled Kalshi event: the market median 14 hours before close, Kalshi’s settlement value, the official first-release value and the miss. Per-contract prices are not included. Free to reuse under CC BY 4.0 with a link back to this page.
Embed this chart
Methodology
- Markets. Kalshi’s
KXTXERCOTPEAKDseries: “Will the highest hourly total system load reported for the ERCOT grid on [day] be above X MW?”, from Kalshi’s public API. Each day’s market opens at midnight Central and closes just before the next midnight, so we price it 14 hours before close (about 10 AM Central), before the afternoon peak. - Official data. ERCOT’s Actual System Load by Weather Zone report (NP6-346-CD), the source in Kalshi’s rules: the highest hourly TOTAL for each operating day. ERCOT posts this report daily and keeps about 30 days online; PredictionScout archives each day’s peak as it is published.
- Benchmark. “Same as yesterday” uses the previous operating day’s ERCOT peak, which is known before the market’s pricing time.
- Market median. For each day we take every “above X” contract’s price 14 hours before trading closed (about 10 AM Central on the operating day) (midpoint of bid and ask from hourly candles when the spread is 10¢ or less, otherwise the last trade; looking back up to 48 hours). Prices are forced to fall as the threshold rises, and the median is the point where the implied chance crosses 50%, interpolated between neighboring thresholds. If the 50% point falls outside the listed thresholds the release is shown but not scored.
- Contracts called right. Each threshold contract counts once: right if the side priced above 50¢ on the morning of the day won. Contracts priced exactly 50¢ are skipped.
- Actual value. The value Kalshi settled on (its “expiration value”), taken from ERCOT’s report. We check it against the first-release value in ALFRED (St. Louis Fed’s archive of data as first published) and mark any difference.
- Limits. One exchange; thin trading in some older and far-out contracts; the market median is a summary of a full distribution, not a single forecast. Nothing here is investment advice. Last run: Oct 23, 2026, 8:32 AM ET.
Cite this research
Suggested citation: PredictionScout. (2026, October 23). ERCOT Peak Demand Prediction Markets vs. the Texas Grid. https://predictionscout.com/research/ercot-peak-demand-prediction-markets/
For a chart or news story: “Source: PredictionScout analysis of public exchange data (https://predictionscout.com/research/ercot-peak-demand-prediction-markets/)”
The data and charts on this page are free to reuse under CC BY 4.0 with a link back to this page. Market data: Kalshi. Load data: Electric Reliability Council of Texas (ERCOT).
Data sources: prices and volumes come from the public APIs of Kalshi and Polymarket, with grid data from ERCOT. All trademarks belong to their owners. PredictionScout is independent and not affiliated with any exchange. Nothing here is investment, betting, or legal advice.
Related: markets vs official numbers · oil markets vs EIA · data-center construction · All research