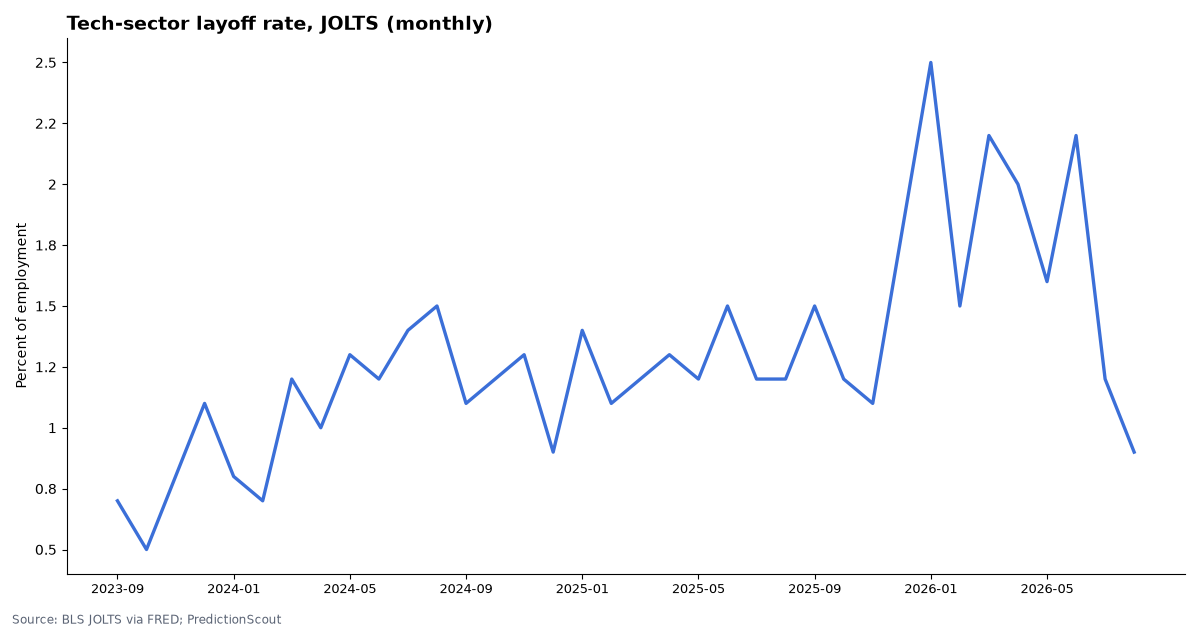
Kalshi’s tech layoff markets went the way the market leaned 21 of 33 times.
Each month Kalshi asks whether the JOLTS layoffs and discharges rate for the Information industry (software, telecom, data hosting, publishing and broadcasting) will top a set level. We priced every settled contract 24 hours before it closed and checked it against the first-print rate the Bureau of Labor Statistics published. The 4 contracts priced at 80¢ or more (or 20¢ or less) a day out were right 2 times.
Kalshi market data and BLS JOLTS data, pulled Oct 23, 2026, 8:31 AM ET. Updated daily.
By Arthur Angelo, PredictionScout Research · Updated Oct 23, 2026, 8:31 AM ET
Key findings
- 21 of 33 contracts (64%) called right a day before the JOLTS release; Brier score 0.262 (0 is perfect, 0.25 is a coin flip).
- Confident calls. 2 of 4 contracts priced at 80¢+ or 20¢ or less went the expected way.
- Biggest surprise: August 2026, “above 0.9%” traded at 90.5¢ and settled No (first print 0.9%).
- Latest rate: 0.9% for August 2026; the 12-month average is 1.6%, against 1.4% in 2019 (current BLS data via FRED).
- Settlements check out. 40 of 40 settlements agree with the JOLTS first print in ALFRED. BLS later revised 29 of those monthly rates; Kalshi settles on the first print.
How the tech layoff market works
Each contract asks one question: will the JOLTS layoffs and discharges rate for the Information industry in a given month be greater than a set level? A Yes contract pays $1 if it is, so a price of 30¢ reads as roughly a 30% chance. The rate is the number of layoffs and discharges during the month (separations the employer initiates) divided by employment, from the Bureau of Labor Statistics’ Job Openings and Labor Turnover Survey. The Information industry covers publishing (including software publishing), film and sound recording, broadcasting, telecommunications, and data processing and hosting. Many companies people think of as tech, such as computer systems design firms and hardware makers, are counted in other industries, so this is a narrow slice of tech employment.
Settlement. Kalshi’s rules name FRED series JTU5100LDR (not seasonally adjusted) and use the first value published for the month; later BLS revisions do not change the result. Trading stops at 9:59 AM ET on JOLTS release day, a minute before BLS publishes at 10:00 AM ET, about a month after the month ends. If the release is delayed, the contract can stay open for up to a month after the expected date.
The edge case that matters most. FRED shows this rate to one decimal place, and “greater than” is strict: a first print exactly equal to the threshold settles No. In 5 of the 40 settled contracts we checked, the first print landed exactly on the threshold.
What moves the number. The Information industry is a small part of the JOLTS sample, and the series is not seasonally adjusted, so the rate jumps around from month to month: over the last three years the median month-to-month change was 0.3 percentage points, against a 12-month average of 1.6%.
Reading the table: a worked example. For August 2026, the contract “above 0.9%” traded at 90.5¢ 24 hours before the Sep 29, 2026 release, so the market leaned Yes. The first print was 0.9%, exactly equal to the threshold, so under the strict “greater than” rule it settled No. That row counts as a miss in the “called right” score. The “Current value” column shows the rate after BLS revisions, for reference only.
Every settled contract
| Month | JOLTS release | Contract | Price 24h before | Result | First print | Current value | Settlement matches | Contracts traded |
|---|---|---|---|---|---|---|---|---|
| Aug 2026 | Sep 29, 2026 | Above 2.4% | no trades | No | 0.9% | 0.9% | ✓ | 34 |
| Aug 2026 | Sep 29, 2026 | Above 2.1% | no trades | No | 0.9% | 0.9% | ✓ | 200 |
| Aug 2026 | Sep 29, 2026 | Above 1.8% | no trades | No | 0.9% | 0.9% | ✓ | 29 |
| Aug 2026 | Sep 29, 2026 | Above 1.5% | no trades | No | 0.9% | 0.9% | ✓ | 469 |
| Aug 2026 | Sep 29, 2026 | Above 1.2% | no trades | No | 0.9% | 0.9% | ✓ | 209 |
| Aug 2026 | Sep 29, 2026 | Above 0.9% | 90.5¢ | No | 0.9% | 0.9% | ✓ | 10 |
| Jul 2026 | Sep 1, 2026 | Above 2.3% | no trades | No | 1.3% | 1.2% | ✓ | 21 |
| Jun 2026 | Aug 4, 2026 | Above 1.9% | 45.5¢ | Yes | 2.3% | 2.2% | ✓ | 397 |
| May 2026 | Jun 30, 2026 | Above 2.2% | 34¢ | No | 1.9% | 1.6% | ✓ | 6,410 |
| Apr 2026 | Jun 2, 2026 | Above 2.4% | 34.5¢ | No | 2.2% | 2.0% | ✓ | 4,865 |
| Mar 2026 | May 5, 2026 | Above 2% | 30.5¢ | Yes | 2.4% | 2.2% | ✓ | 1,157 |
| Feb 2026 | Mar 31, 2026 | Above 2.1% | 19¢ | No | 2.0% | 1.5% | ✓ | 11,756 |
| Jan 2026 | Mar 13, 2026 | Above 1.7% | 54¢ | Yes | 2.1% | 2.5% | ✓ | 13,493 |
| Dec 2025 | Feb 3, 2026 | Above 1.7% | 29.5¢ | No | 1.7% | 1.8% | ✓ | 55,918 |
| Nov 2025 | Jan 7, 2026 | Above 1.4% | 59¢ | Yes | 1.7% | 1.1% | ✓ | 32,167 |
| KXTECHLAYOFF-25SEP | Nov 4, 2025 | Above 1.4% | 34.5¢ | No | n/a | 5,816 | ||
| Aug 2025 | Sep 30, 2025 | Above 1.5% | 42¢ | No | 1.4% | 1.2% | ✓ | 9,590 |
| Jul 2025 | Sep 3, 2025 | Above 1.7% | 41.5¢ | No | 1.5% | 1.2% | ✓ | 10,707 |
| Jun 2025 | Jul 29, 2025 | Above 1% | 59¢ | Yes | 1.7% | 1.5% | ✓ | 16,543 |
| May 2025 | Jul 1, 2025 | Above 1% | 64¢ | No | 1.0% | 1.2% | ✓ | 9,074 |
| Apr 2025 | Jun 3, 2025 | Above 1.2% | 72.5¢ | No | 1.0% | 1.3% | ✓ | 12,962 |
| Mar 2025 | Apr 29, 2025 | Above 1.3% | 36.5¢ | No | 1.2% | 1.2% | ✓ | 6,620 |
| Feb 2025 | Apr 1, 2025 | Above 1.1% | 50¢ | Yes | 1.3% | 1.1% | ✓ | 5,224 |
| Jan 2025 | Mar 11, 2025 | Above 1.1% | 78.5¢ | No | 1.1% | 1.4% | ✓ | 15,213 |
| Nov 2024 | Jan 7, 2025 | Above 0.8% | 64¢ | Yes | 1.4% | 1.3% | ✓ | 6,518 |
| Oct 2024 | Dec 3, 2024 | Above 1.5% | 22¢ | No | 0.8% | 1.2% | ✓ | 88,709 |
| Sep 2024 | Oct 29, 2024 | Above 1.4% | 33.5¢ | Yes | 1.5% | 1.1% | ✓ | 960 |
| Aug 2024 | Oct 1, 2024 | Above 1.4% | 36¢ | No | 1.4% | 1.5% | ✓ | 1,843 |
| Jul 2024 | Sep 4, 2024 | Above 1% | 61.5¢ | Yes | 1.4% | 1.4% | ✓ | 1,237 |
| Jun 2024 | Jul 30, 2024 | Above 1.3% | 32¢ | No | 1.0% | 1.2% | ✓ | 4,618 |
| May 2024 | Jul 2, 2024 | Above 1.1% | 48.5¢ | Yes | 1.3% | 1.3% | ✓ | 3,207 |
| Apr 2024 | Jun 4, 2024 | Above 1.2% | 38¢ | No | 1.1% | 1.0% | ✓ | 2,493 |
| Mar 2024 | May 1, 2024 | Above 0.8% | 64.5¢ | Yes | 1.2% | 1.2% | ✓ | 902 |
| Feb 2024 | Apr 2, 2024 | Above 0.7% | 64.5¢ | Yes | 0.8% | 0.7% | ✓ | 2,005 |
| Jan 2024 | Mar 6, 2024 | Above 1% | 76.5¢ | No | 0.7% | 0.8% | ✓ | 4,945 |
| Dec 2023 | Jan 30, 2024 | Above 0.9% | 71.5¢ | Yes | 1.0% | 1.1% | ✓ | 3,356 |
| Nov 2023 | Jan 3, 2024 | Above 0.6% | 86¢ | Yes | 0.9% | 0.8% | ✓ | 553 |
| Oct 2023 | Dec 5, 2023 | Above 0.7% | 83¢ | No | 0.6% | 0.5% | ✓ | 707 |
| Sep 2023 | Nov 1, 2023 | Above 0.8% | 78¢ | No | 0.7% | 0.7% | ✓ | 1,784 |
| Aug 2023 | Oct 3, 2023 | Above 1.1% | no trades | No | 0.8% | 0.9% | ✓ | 0 |
| Aug 2023 | Oct 3, 2023 | Above 1.1% | 57.5¢ | No | 0.8% | 0.9% | ✓ | 2,934 |
Download the data
One row per settled market period. Per-contract price histories are not included. Free to reuse under CC BY 4.0 with a link back to this page.
Embed this chart
Methodology
- Markets. Kalshi’s
KXTECHLAYOFFseries (“Tech layoff rate above X%?”), from Kalshi’s public API. Each contract is priced 24 hours before trading closed (hourly-candle bid/ask midpoint, or the last trade when the spread is wider than 10¢). - Official data. BLS JOLTS layoffs and discharges rate for the Information industry, not seasonally adjusted (FRED JTU5100LDR, the series Kalshi’s rules name). First prints come from ALFRED, matched by release date.
- Limits. Usually one contract per month, so the sample is small; the Information-industry estimate comes from a small JOLTS sample and is noisy month to month. Nothing here is investment advice. Last run: Oct 23, 2026, 8:31 AM ET.
Cite this research
Suggested citation: PredictionScout. (2026, October 23). Tech Layoff Rate Prediction Markets vs. JOLTS. https://predictionscout.com/research/tech-layoff-rate-prediction-markets/
For a chart or news story: “Source: PredictionScout analysis of public exchange data (https://predictionscout.com/research/tech-layoff-rate-prediction-markets/)”
The data and charts on this page are free to reuse under CC BY 4.0 with a link back to this page. Market data: Kalshi. Layoff rates: U.S. Bureau of Labor Statistics (JOLTS).
Data sources: prices and volumes come from the public APIs of Kalshi and Polymarket, with labor data from the Bureau of Labor Statistics. All trademarks belong to their owners. PredictionScout is independent and not affiliated with any exchange. Nothing here is investment, betting, or legal advice.
Related: jobs report scorecard · ADP markets · recession odds · All research