Kalshi’s CPI component markets leaned the right way on 89% of 304 threshold contracts.
We scored 44 releases across used cars, shelter and gasoline CPI and the average price of electricity, using each market’s prices 24 hours before the BLS release. A day out, the 2026 index markets missed the first print by a median 0.31 index points for shelter, 0.48 for used cars and 2.30 for gasoline.
Kalshi market data and official statistics, pulled Oct 23, 2026, 10:47 AM ET. Updated daily.
By Arthur Angelo, PredictionScout Research · Updated Oct 23, 2026, 10:47 AM ET
Key findings
- 89% of contracts called right. 270 of 304 “above X” contracts across 44 releases went the way the market leaned a day before.
- Shelter: median miss 0.31 index points over 4 releases in 2026; the first print came in above the market median 2 times and below it 2. Biggest miss: Jun 2026 (median 429.28, actual 428.501).
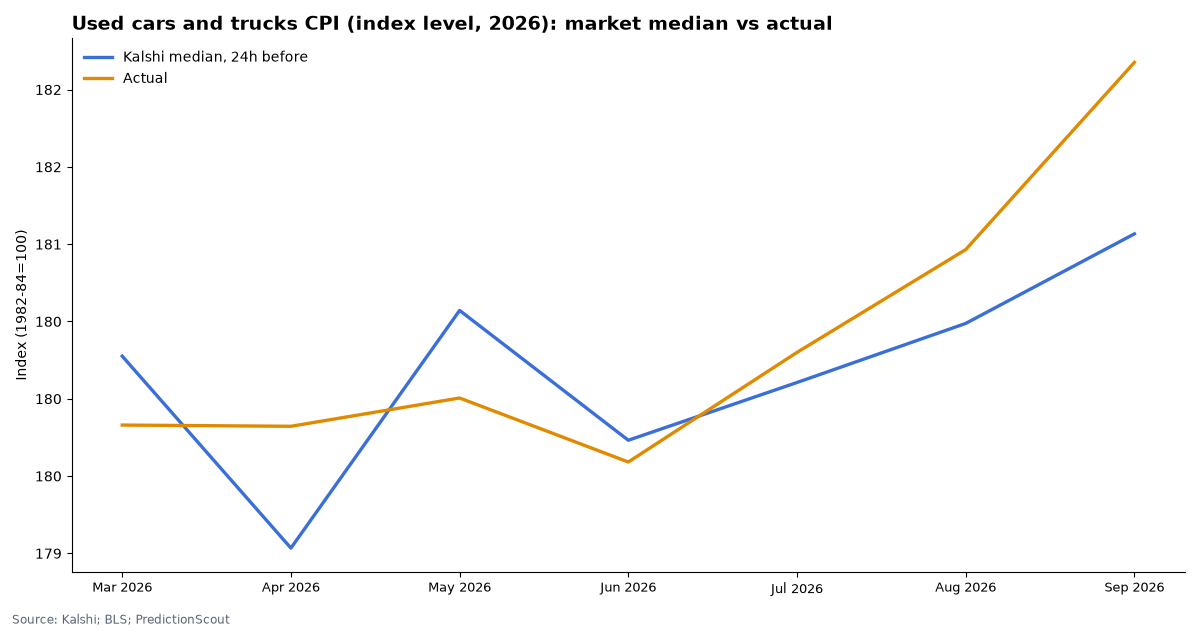
- Used cars: median miss 0.48 index points over 7 releases in 2026; the first print came in above the market median 4 times and below it 3. Biggest miss: Sep 2026 (median 181.07, actual 182.176).
- Gasoline: median miss 2.30 index points over 7 releases in 2026; the first print came in above the market median 4 times and below it 3. Biggest miss: Sep 2026 (median 371.26, actual 376.558).
- Older used cars (% change) markets. 9 releases, median miss 0.60 percentage points on the monthly change.
- Older shelter (% change) markets. 12 releases, median miss 0.06 percentage points on the monthly change.
- Electricity: median miss 0.08¢ per kWh over 5 releases since Kalshi listed the market in June 2026; the market leaned right on 26 of 30 contracts. Only a handful of months have settled, so treat this as an early read.
- Settlement check. 44 of 44 settlements match the BLS first print in ALFRED.
- CPI index-level, owners’ equivalent rent and core goods markets (2 events) settle on the BLS index as first published, which is never revised (index level).
Used cars and trucks CPI (index level, 2026)
Next release: US used cars and trucks CPI for October
Trading closes Tuesday, November 10, 2026, 8:29 AM ET. Market median right now: 180.300. 10,776 contracts traded so far. As of Oct 23, 2026, 10:46 AM ET. Market on Kalshi.
| Contract | Implied chance |
|---|---|
| Above 179 | 94% |
| Above 180 | 62% |
| Above 181 | 22% |
| Above 182 | 5% |
| Above 183 | 28% |
| Above 184 | 7% |
| Above 185 | 6% |
| Above 186 | 2% |
Across 7 releases from Apr 10, 2026 to Oct 14, 2026, the market’s median a day before was off by 0.48 pts in a typical release (median miss) and 0.53 pts on average. The number came in above the market median 4 times and below it 3 times. Of 46 individual “above X” contracts, the side priced above 50¢ a day out was right 43 times (93%).
| Period | Released | Market median 24h before | Actual (Kalshi settlement) | Official first release | Actual minus median | Contracts called right | Contracts traded |
|---|---|---|---|---|---|---|---|
| Sep 2026 | Oct 14, 2026 | 181.067 | 182.176 | 182.176 ✓ | +1.11 pts | 4/5 | 5,805 |
| Aug 2026 | Sep 11, 2026 | 180.487 | 180.965 | 180.965 ✓ | +0.48 pts | 6/6 | 27,550 |
| Jul 2026 | Aug 12, 2026 | 180.105 | 180.300 | 180.306 ✓ | +0.19 pts | 10/11 | 8,616 |
| Jun 2026 | Jul 14, 2026 | 179.732 | 179.591 | 179.591 ✓ | -0.14 pts | 7/7 | 9,528 |
| May 2026 | Jun 10, 2026 | 180.571 | 180.005 | 180.005 ✓ | -0.57 pts | 3/3 | 12,205 |
| Apr 2026 | May 12, 2026 | 179.034 | 179.822 | 179.822 ✓ | +0.79 pts | 7/7 | 10,049 |
| Mar 2026 | Apr 10, 2026 | 180.276 | 179.830 | 179.830 ✓ | -0.45 pts | 6/7 | 7,279 |
Highlighted rows missed by more than 2.00 pts. Official values: BLS Consumer Price Index, used cars and trucks cpi, seasonally adjusted, first print (ALFRED CUSR0000SETA02).
Shelter CPI (index level, 2026)
Next release: US shelter CPI in October
Trading closes Tuesday, November 10, 2026, 8:29 AM ET. Market median right now: 435.000 (outside the listed range). 1,712 contracts traded so far. As of Oct 23, 2026, 10:47 AM ET. Market on Kalshi.
| Contract | Implied chance |
|---|---|
| Above 435.0 | 4% |
| Above 435.1 | 3% |
| Above 435.2 | 3% |
| Above 435.3 | 3% |
| Above 435.4 | 3% |
| Above 435.5 | 3% |
| Above 435.7 | 3% |
| Above 435.8 | 3% |
| Above 435.9 | 3% |
Across 4 releases from Apr 10, 2026 to Sep 11, 2026, the market’s median a day before was off by 0.31 pts in a typical release (median miss) and 0.39 pts on average. The number came in above the market median 2 times and below it 2 times. Of 25 individual “above X” contracts, the side priced above 50¢ a day out was right 18 times (72%).
| Period | Released | Market median 24h before | Actual (Kalshi settlement) | Official first release | Actual minus median | Contracts called right | Contracts traded |
|---|---|---|---|---|---|---|---|
| Aug 2026 | Sep 11, 2026 | 430.046 | 430.227 | 430.227 ✓ | +0.18 pts | 8/10 | 44,364 |
| Jul 2026 | Aug 12, 2026 | 429.403 | 429.090 | 429.095 ✓ | -0.31 pts | 2/2 | 2,162 |
| Jun 2026 | Jul 14, 2026 | 429.280 | 428.501 | 428.501 ✓ | -0.78 pts | 4/8 | 2,223 |
| May 2026 | Jun 10, 2026 | 428.000 | 427.998 | 427.998 ✓ | market median outside listed strikes | 5/6 | 20,714 |
| Apr 2026 | May 12, 2026 | 426.000 | 426.642 | 426.642 ✓ | market median outside listed strikes | 2/2 | 6,839 |
| Mar 2026 | Apr 10, 2026 | 423.786 | 424.069 | 424.069 ✓ | +0.28 pts | 4/5 | 10,900 |
Highlighted rows missed by more than 1.00 pts. Official values: BLS Consumer Price Index, shelter cpi, seasonally adjusted, first print (ALFRED CUSR0000SAH1).
Gasoline CPI (index level, 2026)
Next release: US gasoline CPI for October
Trading closes Tuesday, November 10, 2026, 8:29 AM ET. Market median right now: 381.667. 39,416 contracts traded so far. As of Oct 23, 2026, 10:47 AM ET. Market on Kalshi.
| Contract | Implied chance |
|---|---|
| Above 370 | 96% |
| Above 375 | 91% |
| Above 380 | 66% |
| Above 385 | 17% |
| Above 390 | 4% |
| Above 395 | 4% |
| Above 400 | 4% |
| Above 405 | 3% |
| Above 410 | 2% |
Across 7 releases from Apr 10, 2026 to Oct 14, 2026, the market’s median a day before was off by 2.30 pts in a typical release (median miss) and 2.22 pts on average. The number came in above the market median 4 times and below it 3 times. Of 111 individual “above X” contracts, the side priced above 50¢ a day out was right 104 times (94%).
| Period | Released | Market median 24h before | Actual (Kalshi settlement) | Official first release | Actual minus median | Contracts called right | Contracts traded |
|---|---|---|---|---|---|---|---|
| Sep 2026 | Oct 14, 2026 | 371.258 | 376.558 | 376.558 ✓ | +5.30 pts | 7/7 | 7,747 |
| Aug 2026 | Sep 11, 2026 | 345.922 | 345.169 | 345.169 ✓ | -0.75 pts | 20/20 | 49,403 |
| Jul 2026 | Aug 12, 2026 | 331.343 | 332.215 | 332.215 ✓ | +0.87 pts | 19/20 | 169,365 |
| Jun 2026 | Jul 14, 2026 | 344.738 | 341.980 | 341.980 ✓ | -2.76 pts | 20/23 | 45,049 |
| May 2026 | Jun 10, 2026 | 376.364 | 378.660 | 378.660 ✓ | +2.30 pts | 18/20 | 351,242 |
| Apr 2026 | May 12, 2026 | 354.621 | 353.740 | 353.740 ✓ | -0.88 pts | 4/4 | 10,068 |
| Mar 2026 | Apr 10, 2026 | 332.830 | 335.500 | 335.500 ✓ | +2.67 pts | 16/17 | 43,987 |
Highlighted rows missed by more than 5.00 pts. Official values: BLS Consumer Price Index, gasoline cpi, seasonally adjusted, first print (ALFRED CUSR0000SETB01).
Used cars and trucks CPI (monthly % change, 2023-2025)
Across 9 releases from Oct 12, 2023 to Feb 12, 2025, the market’s median a day before was off by 0.60 pts in a typical release (median miss) and 0.68 pts on average. The number came in above the market median 6 times and below it 3 times. Of 49 individual “above X” contracts, the side priced above 50¢ a day out was right 44 times (90%).
| Period | Released | Market median 24h before | Actual (Kalshi settlement) | Official first release | Actual minus median | Contracts called right | Contracts traded |
|---|---|---|---|---|---|---|---|
| Jan 2025 | Feb 12, 2025 | +1.2% | +2.2% | +2.2% ✓ | +0.99 pts | 3/4 | 2,304 |
| Dec 2024 | Jan 15, 2025 | +0.8% | +1.2% | +1.2% ✓ | +0.39 pts | 6/6 | 1,713 |
| Nov 2024 | Dec 11, 2024 | +1.0% | +2.0% | +2.0% ✓ | +0.97 pts | 4/5 | 21,938 |
| Aug 2024 | Sep 11, 2024 | -0.4% | -1.0% | -1.0% ✓ | -0.60 pts | 4/4 | 3,141 |
| Jul 2024 | Aug 14, 2024 | -1.5% | -2.3% | -2.3% ✓ | market median outside listed strikes | 2/2 | 4,484 |
| Jun 2024 | Jul 11, 2024 | +0.0% | -1.5% | -1.5% ✓ | market median outside listed strikes | 3/3 | 15,279 |
| May 2024 | Jun 12, 2024 | +0.6% | +0.6% | +0.6% ✓ | -0.03 pts | 8/8 | 20,671 |
| Apr 2024 | May 15, 2024 | -1.4% | -1.4% | -1.4% ✓ | +0.01 pts | 5/5 | 68,910 |
| Mar 2024 | Apr 10, 2024 | -1.4% | -1.1% | -1.1% ✓ | +0.28 pts | 7/7 | 19,807 |
| Feb 2024 | Mar 12, 2024 | -1.4% | +0.5% | +0.5% ✓ | +1.86 pts | 5/7 | 61,580 |
| Dec 2023 | Jan 5, 2024 | +1.6% | +0.5% | +1.6% differs | market median outside listed strikes | 2/2 | 6,059 |
| Nov 2023 | Dec 12, 2023 | -0.8% | +1.6% | +1.6% ✓ | market median outside listed strikes | 2/2 | 13,872 |
| Sep 2023 | Oct 12, 2023 | -1.5% | -2.5% | -2.5% ✓ | -0.98 pts | 2/3 | 74,915 |
Highlighted rows missed by more than 1.00 pts. Official values: BLS Consumer Price Index, used cars and trucks cpi, seasonally adjusted, first print (ALFRED CUSR0000SETA02).
Shelter CPI (monthly % change, 2024-2025)
Across 12 releases from Jan 11, 2024 to Feb 12, 2025, the market’s median a day before was off by 0.06 pts in a typical release (median miss) and 0.08 pts on average. The number came in above the market median 7 times and below it 5 times. Of 43 individual “above X” contracts, the side priced above 50¢ a day out was right 35 times (81%).
| Period | Released | Market median 24h before | Actual (Kalshi settlement) | Official first release | Actual minus median | Contracts called right | Contracts traded |
|---|---|---|---|---|---|---|---|
| Jan 2025 | Feb 12, 2025 | +0.3% | +0.4% | +0.4% ✓ | +0.12 pts | 2/3 | 4,427 |
| Dec 2024 | Jan 15, 2025 | +0.3% | +0.3% | +0.3% ✓ | -0.00 pts | 3/4 | 7,122 |
| Nov 2024 | Dec 11, 2024 | +0.3% | +0.3% | +0.3% ✓ | +0.03 pts | 5/5 | 32,199 |
| Sep 2024 | Oct 10, 2024 | +0.3% | +0.2% | +0.2% ✓ | -0.14 pts | 2/2 | 1,444 |
| Jul 2024 | Aug 14, 2024 | +0.2% | +0.4% | +0.4% ✓ | +0.18 pts | 4/5 | 6,408 |
| Jun 2024 | Jul 11, 2024 | +0.2% | +0.2% | +0.2% ✓ | -0.04 pts | 2/3 | 3,686 |
| May 2024 | Jun 12, 2024 | +0.3% | +0.4% | +0.4% ✓ | +0.07 pts | 3/3 | 9,911 |
| Apr 2024 | May 15, 2024 | +0.4% | +0.4% | +0.4% ✓ | -0.01 pts | 3/4 | 12,099 |
| Mar 2024 | Apr 10, 2024 | +0.3% | +0.4% | +0.4% ✓ | +0.06 pts | 3/3 | 8,206 |
| Feb 2024 | Mar 12, 2024 | +0.4% | +0.4% | +0.4% ✓ | -0.01 pts | 3/4 | 7,204 |
| Jan 2024 | Feb 13, 2024 | +0.4% | +0.6% | +0.6% ✓ | +0.23 pts | 1/3 | 5,642 |
| Dec 2023 | Jan 11, 2024 | +0.5% | +0.5% | +0.5% ✓ | +0.05 pts | 4/4 | 17,823 |
Highlighted rows missed by more than 0.20 pts. Official values: BLS Consumer Price Index, shelter cpi, seasonally adjusted, first print (ALFRED CUSR0000SAH1).
Electricity, average price per kWh (2026)
Next release: US electricity price in October
Trading closes Tuesday, November 10, 2026, 8:29 AM ET. Market median right now: 19.4¢. 1,704 contracts traded so far. As of Oct 23, 2026, 10:47 AM ET. Market on Kalshi.
| Contract | Implied chance |
|---|---|
| Above 19.0¢ | 98% |
| Above 19.2¢ | 92% |
| Above 19.4¢ | 46% |
| Above 19.6¢ | 30% |
| Above 19.8¢ | 21% |
| Above 20.0¢ | 4% |
Across 5 releases from Jun 10, 2026 to Oct 14, 2026, the market’s median a day before was off by 0.08¢ in a typical release (median miss) and 0.20¢ on average. The number came in above the market median 2 times and below it 3 times. Of 30 individual “above X” contracts, the side priced above 50¢ a day out was right 26 times (87%).
| Period | Released | Market median 24h before | Actual (Kalshi settlement) | Official first release | Actual minus median | Contracts called right | Contracts traded |
|---|---|---|---|---|---|---|---|
| Sep 2026 | Oct 14, 2026 | 19.5¢ | 19.6¢ | 19.6¢ ✓ | +0.07¢ | 2/2 | 211 |
| Aug 2026 | Sep 11, 2026 | 19.6¢ | 19.6¢ | 19.6¢ ✓ | -0.02¢ | 6/7 | 44,868 |
| Jul 2026 | Aug 12, 2026 | 20.4¢ | 19.7¢ | 19.7¢ ✓ | -0.71¢ | 2/4 | 6,203 |
| Jun 2026 | Jul 14, 2026 | 19.9¢ | 19.8¢ | 19.8¢ ✓ | -0.12¢ | 10/11 | 27,956 |
| May 2026 | Jun 10, 2026 | 19.5¢ | 19.6¢ | 19.6¢ ✓ | +0.08¢ | 6/6 | 7,941 |
Highlighted rows missed by more than 0.30¢. Official values: BLS average price of electricity per kilowatt-hour, U.S. city average, not seasonally adjusted, first print (ALFRED APU000072610).
CPI index level, owners’ equivalent rent and core goods
Most CPI markets ask about percentage changes. These three ask about something else: the index level itself (not seasonally adjusted, 1982–84 = 100), the owners’ equivalent rent index level, and the seasonally adjusted monthly change in core goods prices.
How they settle. On the BLS CPI release for the named month, using the published index to three decimals (or the change to one decimal). Index levels are not seasonally adjusted and are not revised, so the first print is final.
What moves them. For the all-items level, the monthly change: at an index near 337, a 0.1% move is about 0.34 index points, so each rung of a 0.1-point ladder is a little under 0.03% of inflation. Seasonal patterns matter because the index is not adjusted; October is often soft for energy. OER moves slowly, about 0.3% a month.
Worked example. September’s CPI-U was 336.940. If October’s not-seasonally-adjusted change is +0.2%, the index lands near 337.61, so “above 337.6” would resolve Yes and “above 337.7” No.
| Market | Market middle | Ladder (chance above) | Latest BLS value | Contracts traded |
|---|---|---|---|---|
| CPI-U index, all items (NSA) | prices out of order | >335.8: 95% · >335.9: 94% · >336: 56% · >336.1: 51% · >336.2: 51% · >336.3: 95% | 336.940 (month 9 2026) | 12,382 |
| Owners’ equivalent rent index (NSA) | prices out of order | >449.5: 96% · >449.6: 3% · >449.7: 1% · >449.8: 1% · >449.9: 1% · >450: 5% | 445.310 (month 9 2026) | 5,297 |
Several rungs on these ladders trade rarely, so prices can be stale and out of order; the middle uses prices forced to fall as the threshold rises.
Market middle: for “above X” ladders, the point where the implied chance crosses 50% (prices forced to fall as the threshold rises, interpolated between rungs). Prices are the bid/ask midpoint when the spread is 10¢ or less, otherwise the last trade. Events with fewer than 500 contracts traded show “thin trading” instead of a middle, and ladders whose quoted prices contradict each other show “prices out of order”. Pulled Oct 23, 2026, 10:47 AM ET.
Download the data
Release-by-release scorecard (CSV)CPI index level, OER and core goods ladders (live) (CSV)
One row per settled Kalshi event: the market median 24 hours before, Kalshi’s settlement value, the official first-release value and the miss. Per-contract prices are not included. Free to reuse under CC BY 4.0 with a link back to this page.
Embed this chart
Methodology
- Markets. Kalshi’s 2026 series
KXUSEDCARCPI,KXSHELTERCPIandKXUSGASCPI(“above X” on the seasonally adjusted index level) and the olderKXCPIUSEDCARandKXCPISHELTERseries (“above X%” on the monthly change), from Kalshi’s public API. - Electricity. Kalshi’s
KXPOWERKWH(“above X cents” on the BLS average price of electricity per kilowatt-hour, U.S. city average, not seasonally adjusted) settles on the first value FRED publishes for series APU000072610; we compare with the ALFRED first vintage, converted from dollars to cents. Kalshi’s weekly PJM, ERCOT and MISO wholesale power markets have not settled yet and are not scored. - Official data. BLS Consumer Price Index series CUSR0000SETA02 (used cars and trucks), CUSR0000SAH1 (shelter) and CUSR0000SETB01 (gasoline, all types), seasonally adjusted, as first published, from ALFRED. BLS revises seasonally adjusted values each February; markets settle on the first print. Kalshi sometimes displays its settlement value rounded (180.3 for 180.306); differences under 0.01 index points count as a match.
- Market median. For each release we take every “above X” contract’s price 24 hours before trading closed (midpoint of bid and ask from hourly candles when the spread is 10¢ or less, otherwise the last trade; looking back up to 48 hours). Prices are forced to fall as the threshold rises, and the median is the point where the implied chance crosses 50%, interpolated between neighboring thresholds. If the 50% point falls outside the listed thresholds the release is shown but not scored.
- Contracts called right. Each threshold contract counts once: right if the side priced above 50¢ a day before won. Contracts priced exactly 50¢ are skipped.
- Actual value. The value Kalshi settled on (its “expiration value”), which follows the first official release. We check it against the first-release value in ALFRED (St. Louis Fed’s archive of data as first published) and mark any difference.
- Limits. One exchange; thin trading in some older and far-out contracts; the market median is a summary of a full distribution, not a single forecast. Nothing here is investment advice. Last run: Oct 23, 2026, 10:47 AM ET.
Cite this research
Suggested citation: PredictionScout. (2026, October 23). CPI Components Prediction Markets: Used Cars, Shelter and Gasoline vs. BLS. https://predictionscout.com/research/cpi-components-prediction-market-accuracy/
For a chart or news story: “Source: PredictionScout analysis of public exchange data (https://predictionscout.com/research/cpi-components-prediction-market-accuracy/)”
The data and charts on this page are free to reuse under CC BY 4.0 with a link back to this page. Market data: Kalshi. CPI: U.S. Bureau of Labor Statistics via ALFRED.
Data sources: prices and volumes come from the public APIs of Kalshi and Polymarket, with price data from the Bureau of Labor Statistics. All trademarks belong to their owners. PredictionScout is independent and not affiliated with any exchange. Nothing here is investment, betting, or legal advice.
Related: CPI scorecard · egg prices · state gas prices · All research